Many realize the strengths of Net Promoter ScoreSM but few exploit the full potential of NPS® in an automated feedback program. In this blog we will go in depth on how to get NPS to the next level and effectively set up an automated feedback loop. We illustrate this with the ‘the 4 stages of Net Promoter Score’. Starting from inviting your customers to a classic customer satisfaction survey going to integrating the Net Promoter Score approach as an early churn detection and prevention mechanism into your Business Intelligence Software.
What stage are you in?
Whenever we talk about our NPS projects here at CheckMarket we define what stage that project is in. The flowchart above visualizes the full workflow of an automated NPS program. We will be breaking it down into four steps that businesses went or go through when setting up their NPS feedback program. While we go through the various stages of NPS you can determine which stage your company is in right now and what next steps you can take to bring your NPS program to the next level.
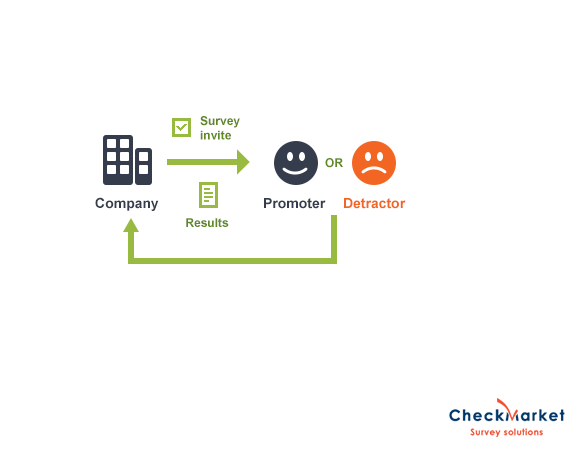
Stage 1: “Everyone is asking this NPS question, I better ask it too!”
In this stage businesses measure their NPS for the sake of measuring. They send out an invitation to an NPS survey, get the results back from the survey and they stop there. Companies don’t actively try to improve their score in stage 1. “Oh look, we now know our NPS score. Let’s measure it again next year and hope our score went up.”
Stage 2: Alerts for unsatisfied customers
The second stage adds a flow of automated alerts when respondents give a low score. Usually businesses choose to cover the entire group of detractors with a score from 0 to 6 but you can also choose to narrow that window (e.g. score 0-4) if you experiencing large volumes of alerts. These alerts are sent to your support team or account manager including some open text about why people were unhappy with the provided service. Then your team tries to get that detractor back online.
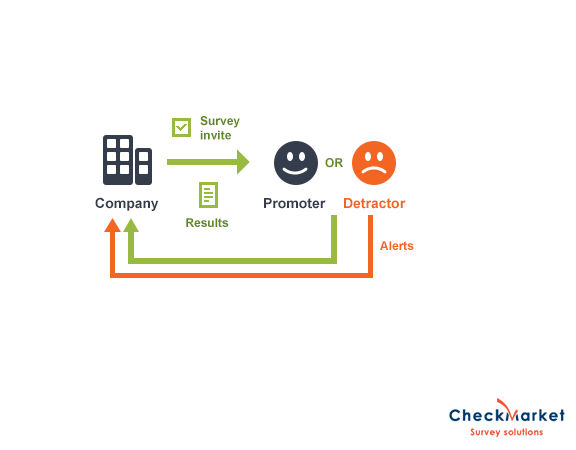
All these alerts are coming back. Your support team and account managers are getting notifications and contacting detractors. At the management level, however, there is a link missing. Management has no idea what the effectiveness is of the NPS feedback program, because they simply aren’t tracking the results. Most businesses are in this stage right now. This stage is definitely better than stage one since you are actively trying to improve your NPS score but this stage lacks the structure of getting the data back to the management level:
- How many detractors are we getting feedback from?
- What incentives are we giving them to resolve their issues?
- What type of incentive works best for what type of issue?
- What are the major categories people have issues with?
- How do we translate that plain text into structured reporting that management can actually do something with?
Stage 3: Manage automated workflow
In the flow chart you will see that the alerts transformed into a dedicated feedback loop. The biggest hurdle from building your automated NPS program is going from stage 2 to stage 3. In order to have a successful stage 3 you have to create a dedicated NPS follow-up team inside your company. When there is a detractor a follow-up form is sent to your follow-up team instead of the basic alert. The team will fill in their own survey (with all the data from the clients NPS survey pumped into it) to answer questions that helps break down all the detractors’ feedback into categories for a structured reporting.
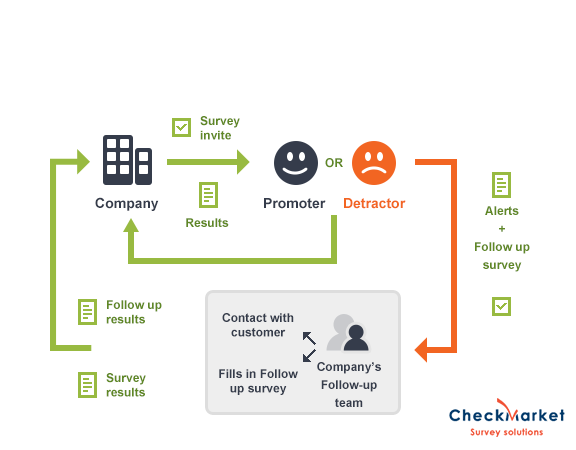
Firstly they will be tracking their calls: “I tried to call person X at this time, I was successful at that time or I’m going to call back person X later”. This allows your follow-up team to share the workload so nobody is calling the same person twice. You can exactly track how many open and closed follow-ups still to be done.
Secondly they will try to identify the underlying reasons of the detractor and divide the open feedback into categories. It’s crucial to let your follow-up team categorize the feedback. When asking “What can we do better?” or “What did we do wrong?” you don’t want to put words into the respondent’s mouth by giving them a fixed list of possible issues like “bad service” or “late delivery”. At the end of your clients you want an open response. At the end of your follow-up team, however, you want to be as specific as possible in order to get closed answers. In the follow-up survey you want to be as specific as possible paired with an ‘other’ response option. Over time we recommend to analyze the responses in the ‘other’ category. You will be able to identify recurring items and put those items as fixed categories in the response list.
With the structured data coming back from your detractors you can also do A/B testing of your incentive with your detractor strategy. You can for example give your detractors 1,000 text messages for free or you can make your detractor commit to a two year deal where they get $ 10 off each month. In the results of the follow-up survey you can determine which incentive works best for which detractor category.
Structured data from your detractors will flow back into your company in the format of dashboards, report forms or custom integrations. Management can then analyze the data at least monthly to take actions to improve the categories where the most complaints are coming from. It’s important you get to this stage as fast as possible. You will notice the structured data from the follow-up team really improves the quality of data you receive. We have lots of data these days but the real value is the quality of information that flows back to management.
Stage 4: Integrate with Business Intelligence Software
The final stage is going to add a layer at the top of the company in the flowchart. We’re calling it Big Data. It’s probably some kind of Business Intelligence Software (e.g. SAP, Microsoft Dynamics) where you will be crunching all the different data streams. Another telecom example explains the dynamic between your business intelligence software and the NPS feedback program well. Person X (churns and) switches to a different telecom provider. The business intelligence systems will determine the influence of person X on other people of his personal network. What influence will this person X have on his personal network and are therefore others in his network at risk of switching to a different provider? The Business Intelligence Software (BIS) will use all kinds of data streams to identify the strength of the social connection between person X and person Y. Frequent and long calls between person X and Y will make their social connection more important.
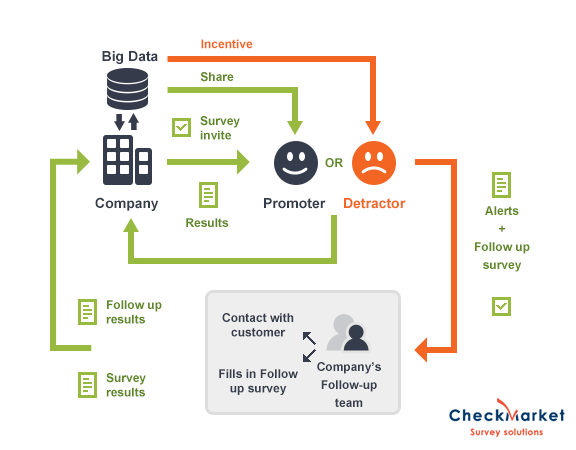
Now the NPS feedback program comes into play. There could be two sources here to use the NPS survey; as another data stream or as confirmation of your churn identification. The NPS survey as a data stream contributes to the churn risk coefficient as one of many factors. The other case where the survey serves as a confirmation NPS plays a much bigger role. When your BIS identified an at risk client (based on other data streams) you can send out a survey as a trigger to confirm your churn identification is working. If the client then indeed gives a low score, you will know that client is indeed at risk of churning. In short, the NPS feedback program can be a positive feedback mechanism for your churn identification. The score itself can alter the churn risk coefficient to improve the business intelligence software.
Based on this flow you can set up an automated system with incentives to win back the at-risk customer when you are dealing with large volumes because you might not be screening every single detractor with your follow-up team. Based on the client’s feedback and other data streams you can send them that deal with 1.000 monthly free text messages or that deal to lock them down into a two year package with a great offer to stop them from detracting. To stop one client from detracting is a bigger deal than it might look at the surface. One detractor is like a snowball rolling down the slope taking others in his personal network with them, those people from his network will do the same and that starts a vicious cycle. A cycle that is near impossible to stop when you leave it unattended. If you can put a stick in front of that one client to prevent that person from detracting, you are not only saving this particular detractor but many others in his network at the same time with the same effort.
Naturally this flow is a two-way street. You can turn it around and activate your promoters to promote your company or product. Give them the place and time to be your ambassador and bring in new customers. Involve your promoters in communities, beta testing of your new software or tastings of your new product. Encourage them to share their love of your company on social media or their blog. Give your promoters the tools to be your ambassador and enable them to share.
Conclusion
The workflow is a full diagram of the survey going out, getting information, using the information to improve your services so you will have less detractors in the future, then trying to stop those detractors from churning and putting their whole network out of risk for churning, identifying promoters and using them as your ambassadors. That’s the final stage of an NPS feedback program. Now, you are able to tell which stage your company is in right now and how you can bring your company to the next level using Net Promoter Score.
Net Promoter and NPS are registered service marks, and Net Promoter Score and Net Promoter System are service marks, of Bain & Company, Inc., Satmetrix Systems, Inc. and Fred Reichheld.
Video: the 4 stages of Net Promoter Score explained
Check our NPS webinars
Have a chat with our Net Promoter Score research experts
We have a lot of experience in NPS research. For example, our blog article about the basics of NPS has more than 110.000 views. It’s the authority in the world of market research. Our research experts embody this experience in NPS and can help you set up your NPS program or bring your existing program to the next level.
We have a fully developed tool that can do everything going from measuring NPS continuously to organizing/automating the follow-up and from displaying NPS dashboards with real-time results to integrating with your internal application (API).
![]() Contact us at [email protected].
Contact us at [email protected].
Related articles
- Learn everything about the the use, application and pitfalls of Net Promoter Score
- Why you shouldn’t be buying NPS benchmarks
- Discover our built-in features for NPS on a single page
- We need an NPS-EU
- NPS clearly explained in 14 slides (Slideshare)
- Try a sample NPS survey
- Look at sample NPS survey results
(Password to access results: NPScore) - Use our NPS survey template
- Send automatic email notifications
- Set up the “Create contact” notification
- Use our NPS Calculator
1 comment
Join the conversationEverto - March, 2015
Nice article!