We are introducing key driver analysis (KDA) to our survey reports. Great insights without specialty statistical software. A key driver analysis examines the relationships between potential drivers and behavior such as the likelihood of a positive recommendation (NPS).
What is it for?
It’s important to identify and understand the drivers of key business metrics, such as customer satisfaction or loyalty, in order to improve processes and profitability. If you are conducting NPS surveys, you will want to understand, which aspects of your service or product influence how likely a customer will be to recommend you to others. A key driver analysis is used to address exactly this sort of question.
By knowing which elements influence your overall satisfaction and loyalty the most, you will know where your organization should be putting its energy.
How does it work?
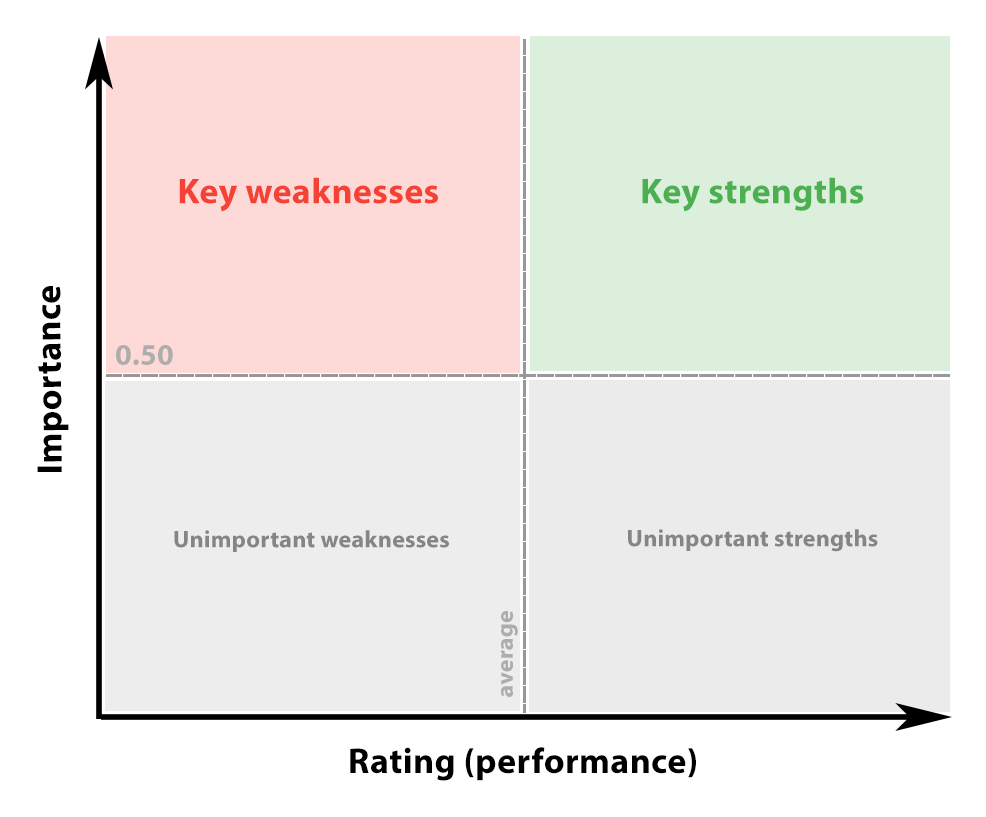
Our KDA works by using multiple linear regression to investigate the correlations between one outcome metric and one or more potential drivers and then plotting them on an easy to read chart. We do the heavy statistical lifting for you so that you have more time to work on the insights we provide.
Example please?
The outcome metric is the term used for the main question in your survey. Usually it is the overall satisfaction or NPS (loyalty) question. For instance: On a scale of 1 to 10, how satisfied were you overall with your stay at the Grand Hotel?
Potential Driver is the term used for performance rating questions in your survey which you think influence your primary question or outcome metric as it is known.Continuing the example above, we may ask respondents to rate aspects of our hotel, such as cleanliness, food, swimming pool, staff, etc. But which one should we invest in? Which one would give us the best ROI?
Leave a Reply