The Conjoint feature allows your organization to understand and analyze consumer preferences across marketing and product research use cases. Utilizing Conjoint is especially useful in designing a new product or product line extensions, estimating brand equity, measuring price sensitivity (elasticity), as well as branding and packaging. The following are example questions that Conjoint can help your organization answer:
- Should we offer business-class passengers more seat room or in-flight internet access?
- Should we offer a 2.5L engine or a 6.0L engine in the new SUVs?
Conjoint helps determine how people value different attributes (features, functions, benefits) that make up an individual product or service. Respondents may not be able to accurately express their valuations of different attributes and attribute levels; as such, Conjoint asks respondents to provide overall evaluations for different bundles of attributes (products).
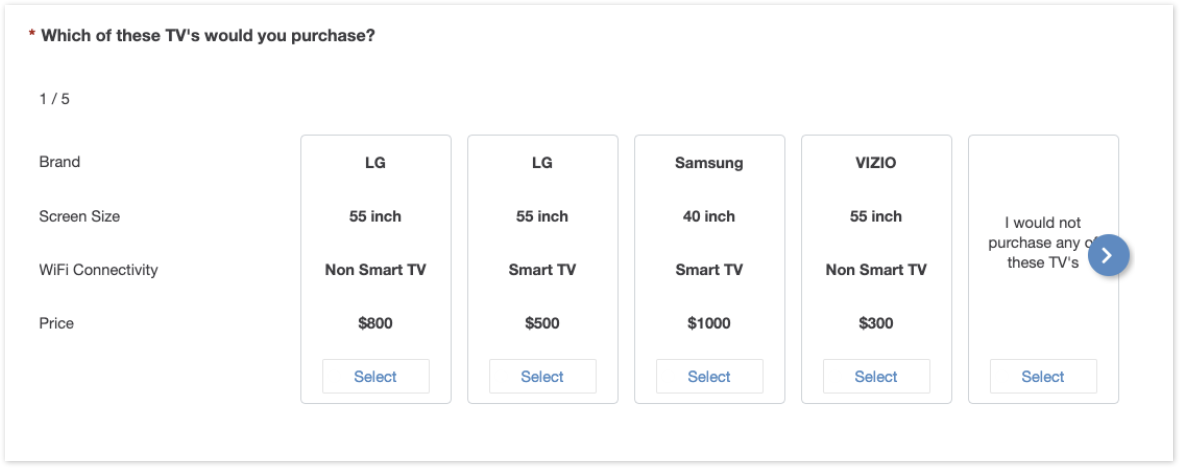
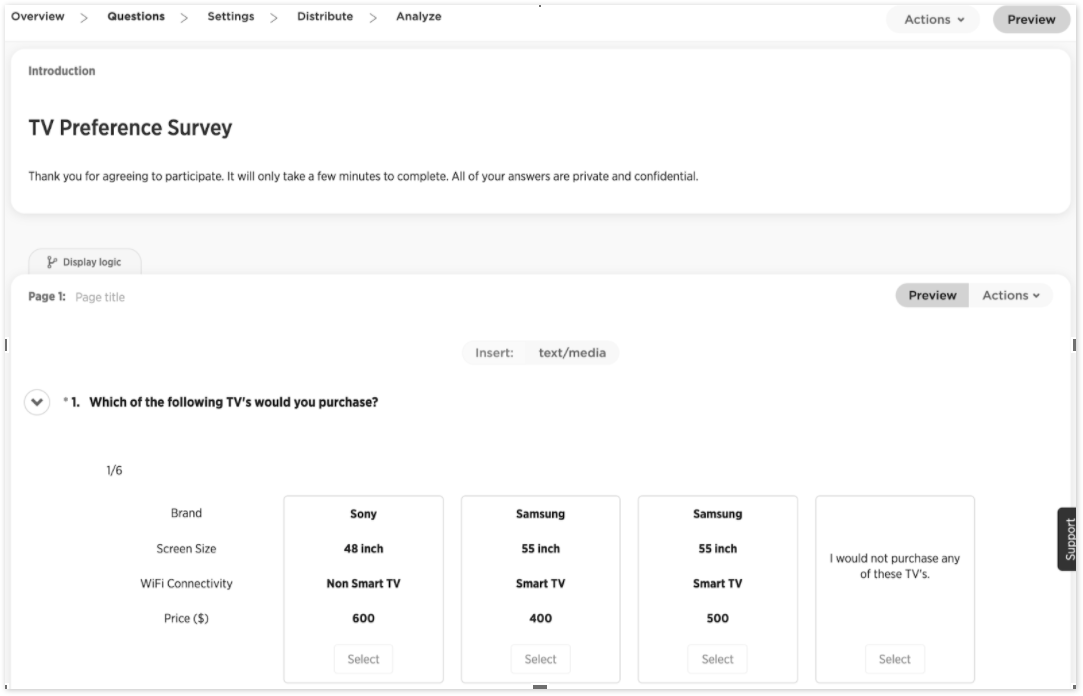
When you add a Conjoint question to a survey, respondents are shown a series of options (product offerings with varying attributes) and asked to select the one they would most likely buy.
Note: A low number of respondents can produce unexpected data and results on reports. To be statistically significant, a respondent count of 150 is recommended.
The following is an example of a Conjoint question on a survey.
Configuring a Conjoint Survey
You can configure Conjoint questions to include images or text as attributes in the question layout. Each question will appear on a separate page. For each Conjoint question, respondents are required to evaluate the combination of attributes on each of the cards and select which product offerings they view as most favorable. Respondents can save questions and responses and complete them at a later time.
To add a Conjoint question to a survey and configure the survey, complete the following steps:
1. Create a survey and then add a question to it. Select the Conjoint question from the Choice Based Tools section of the survey editor.
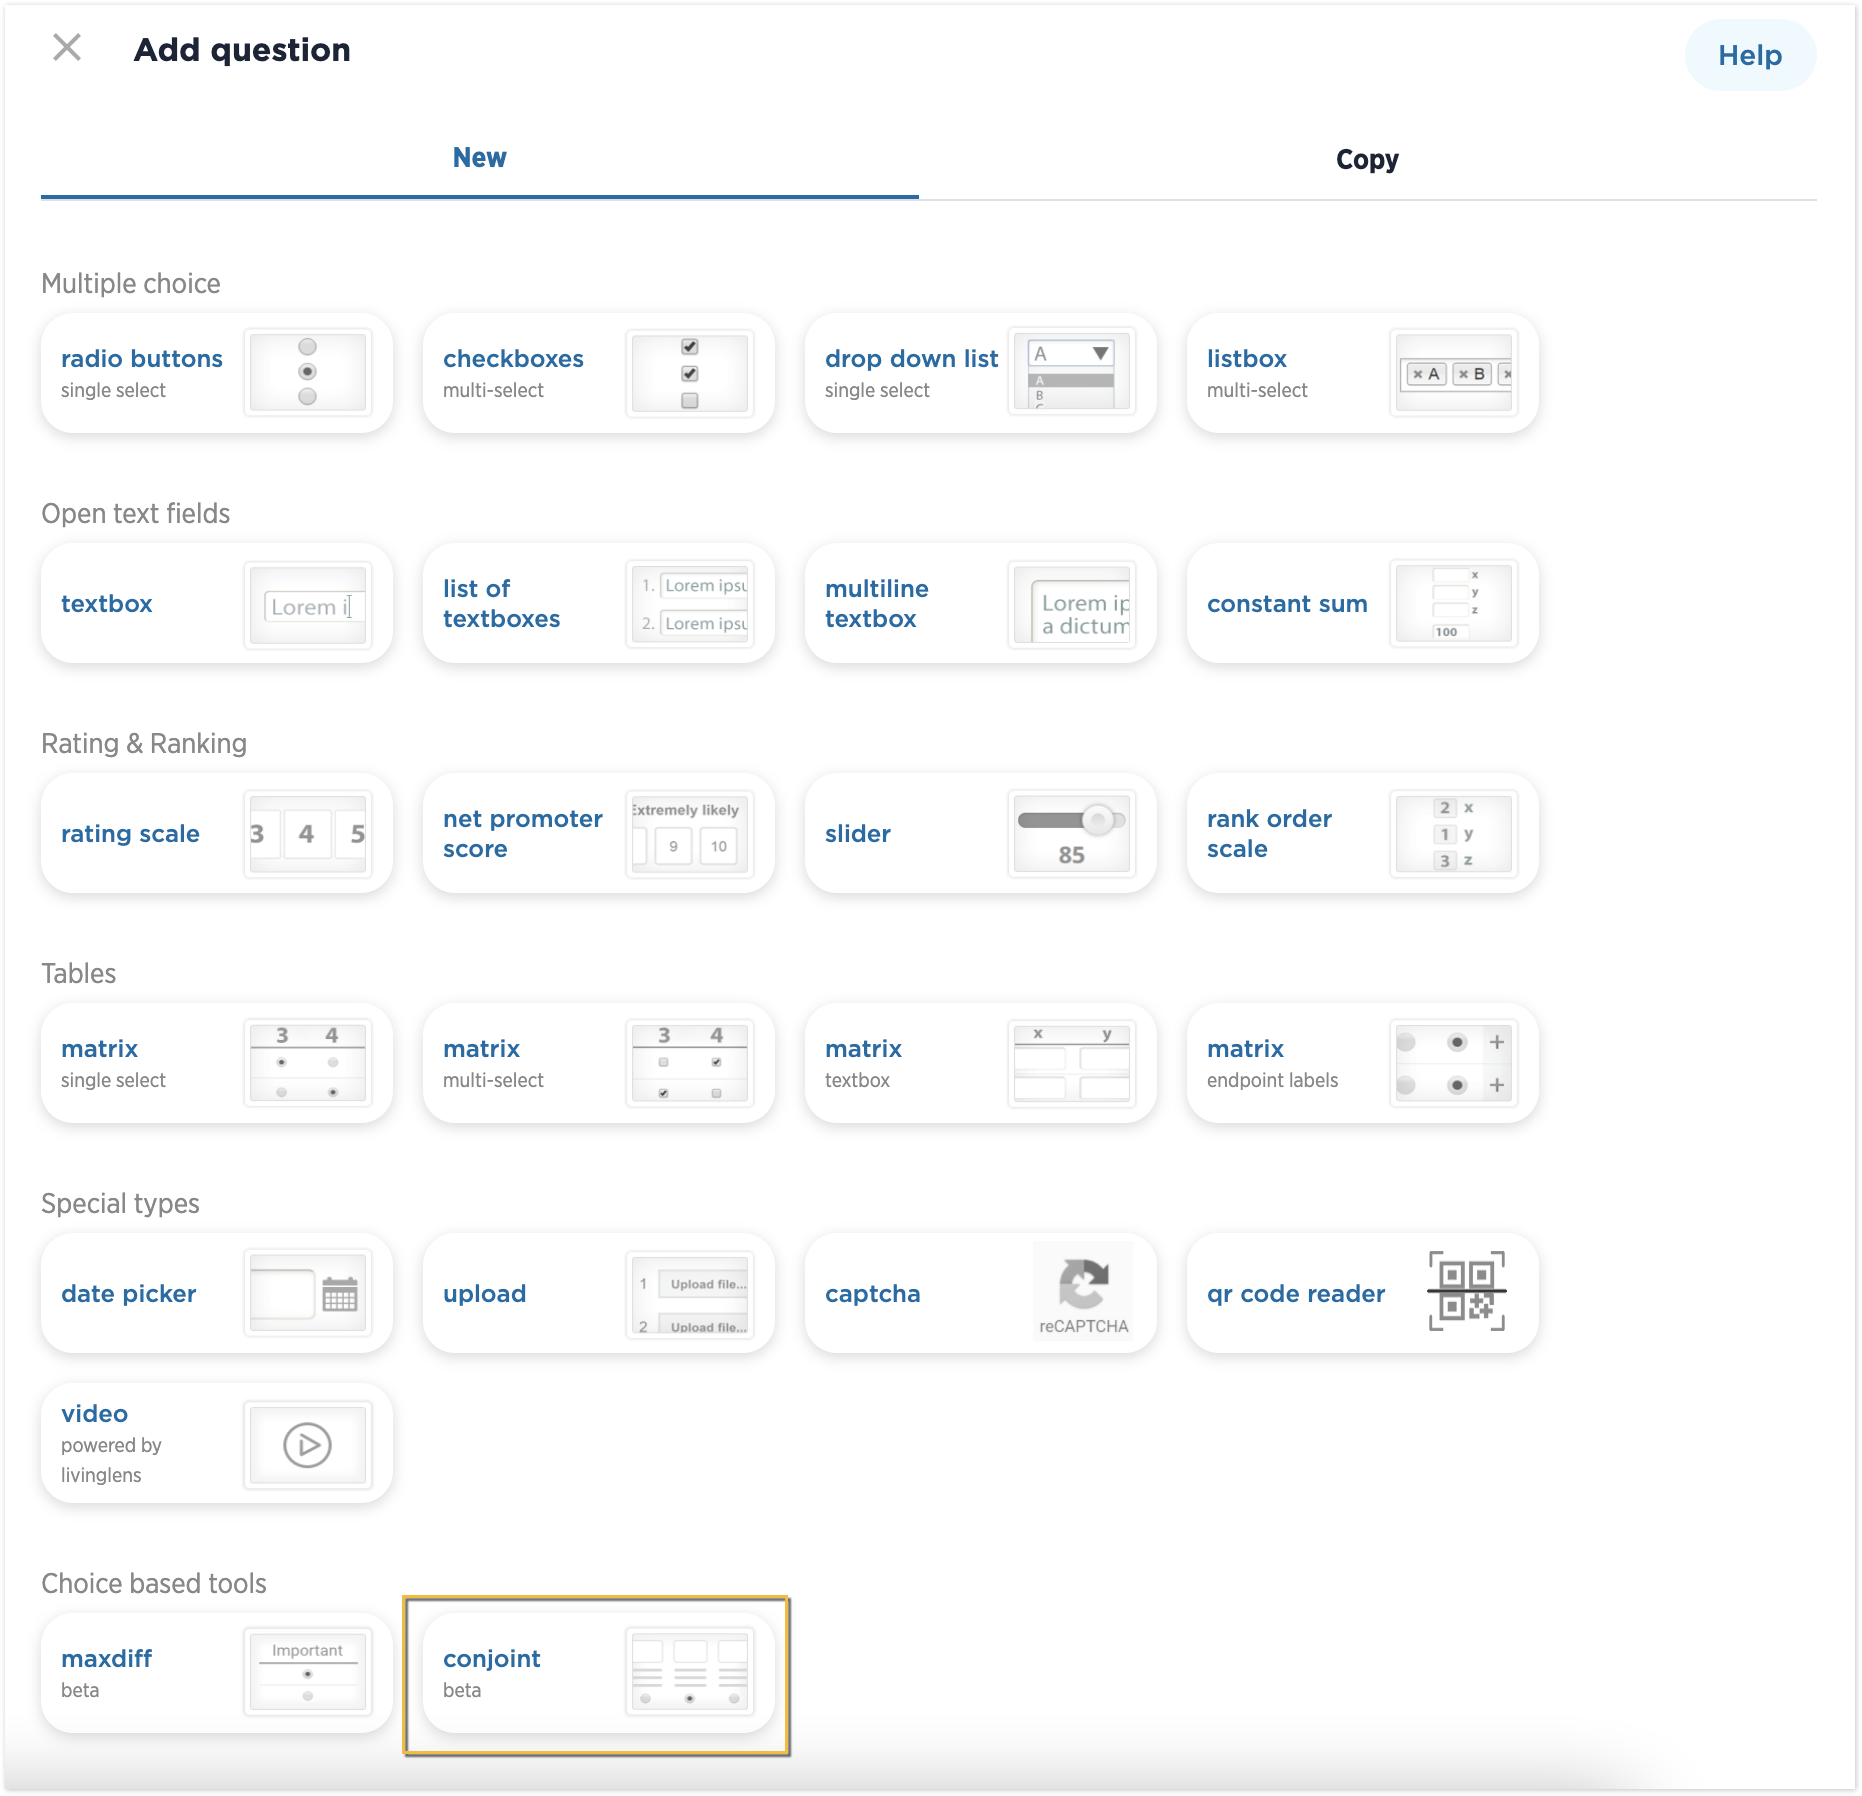
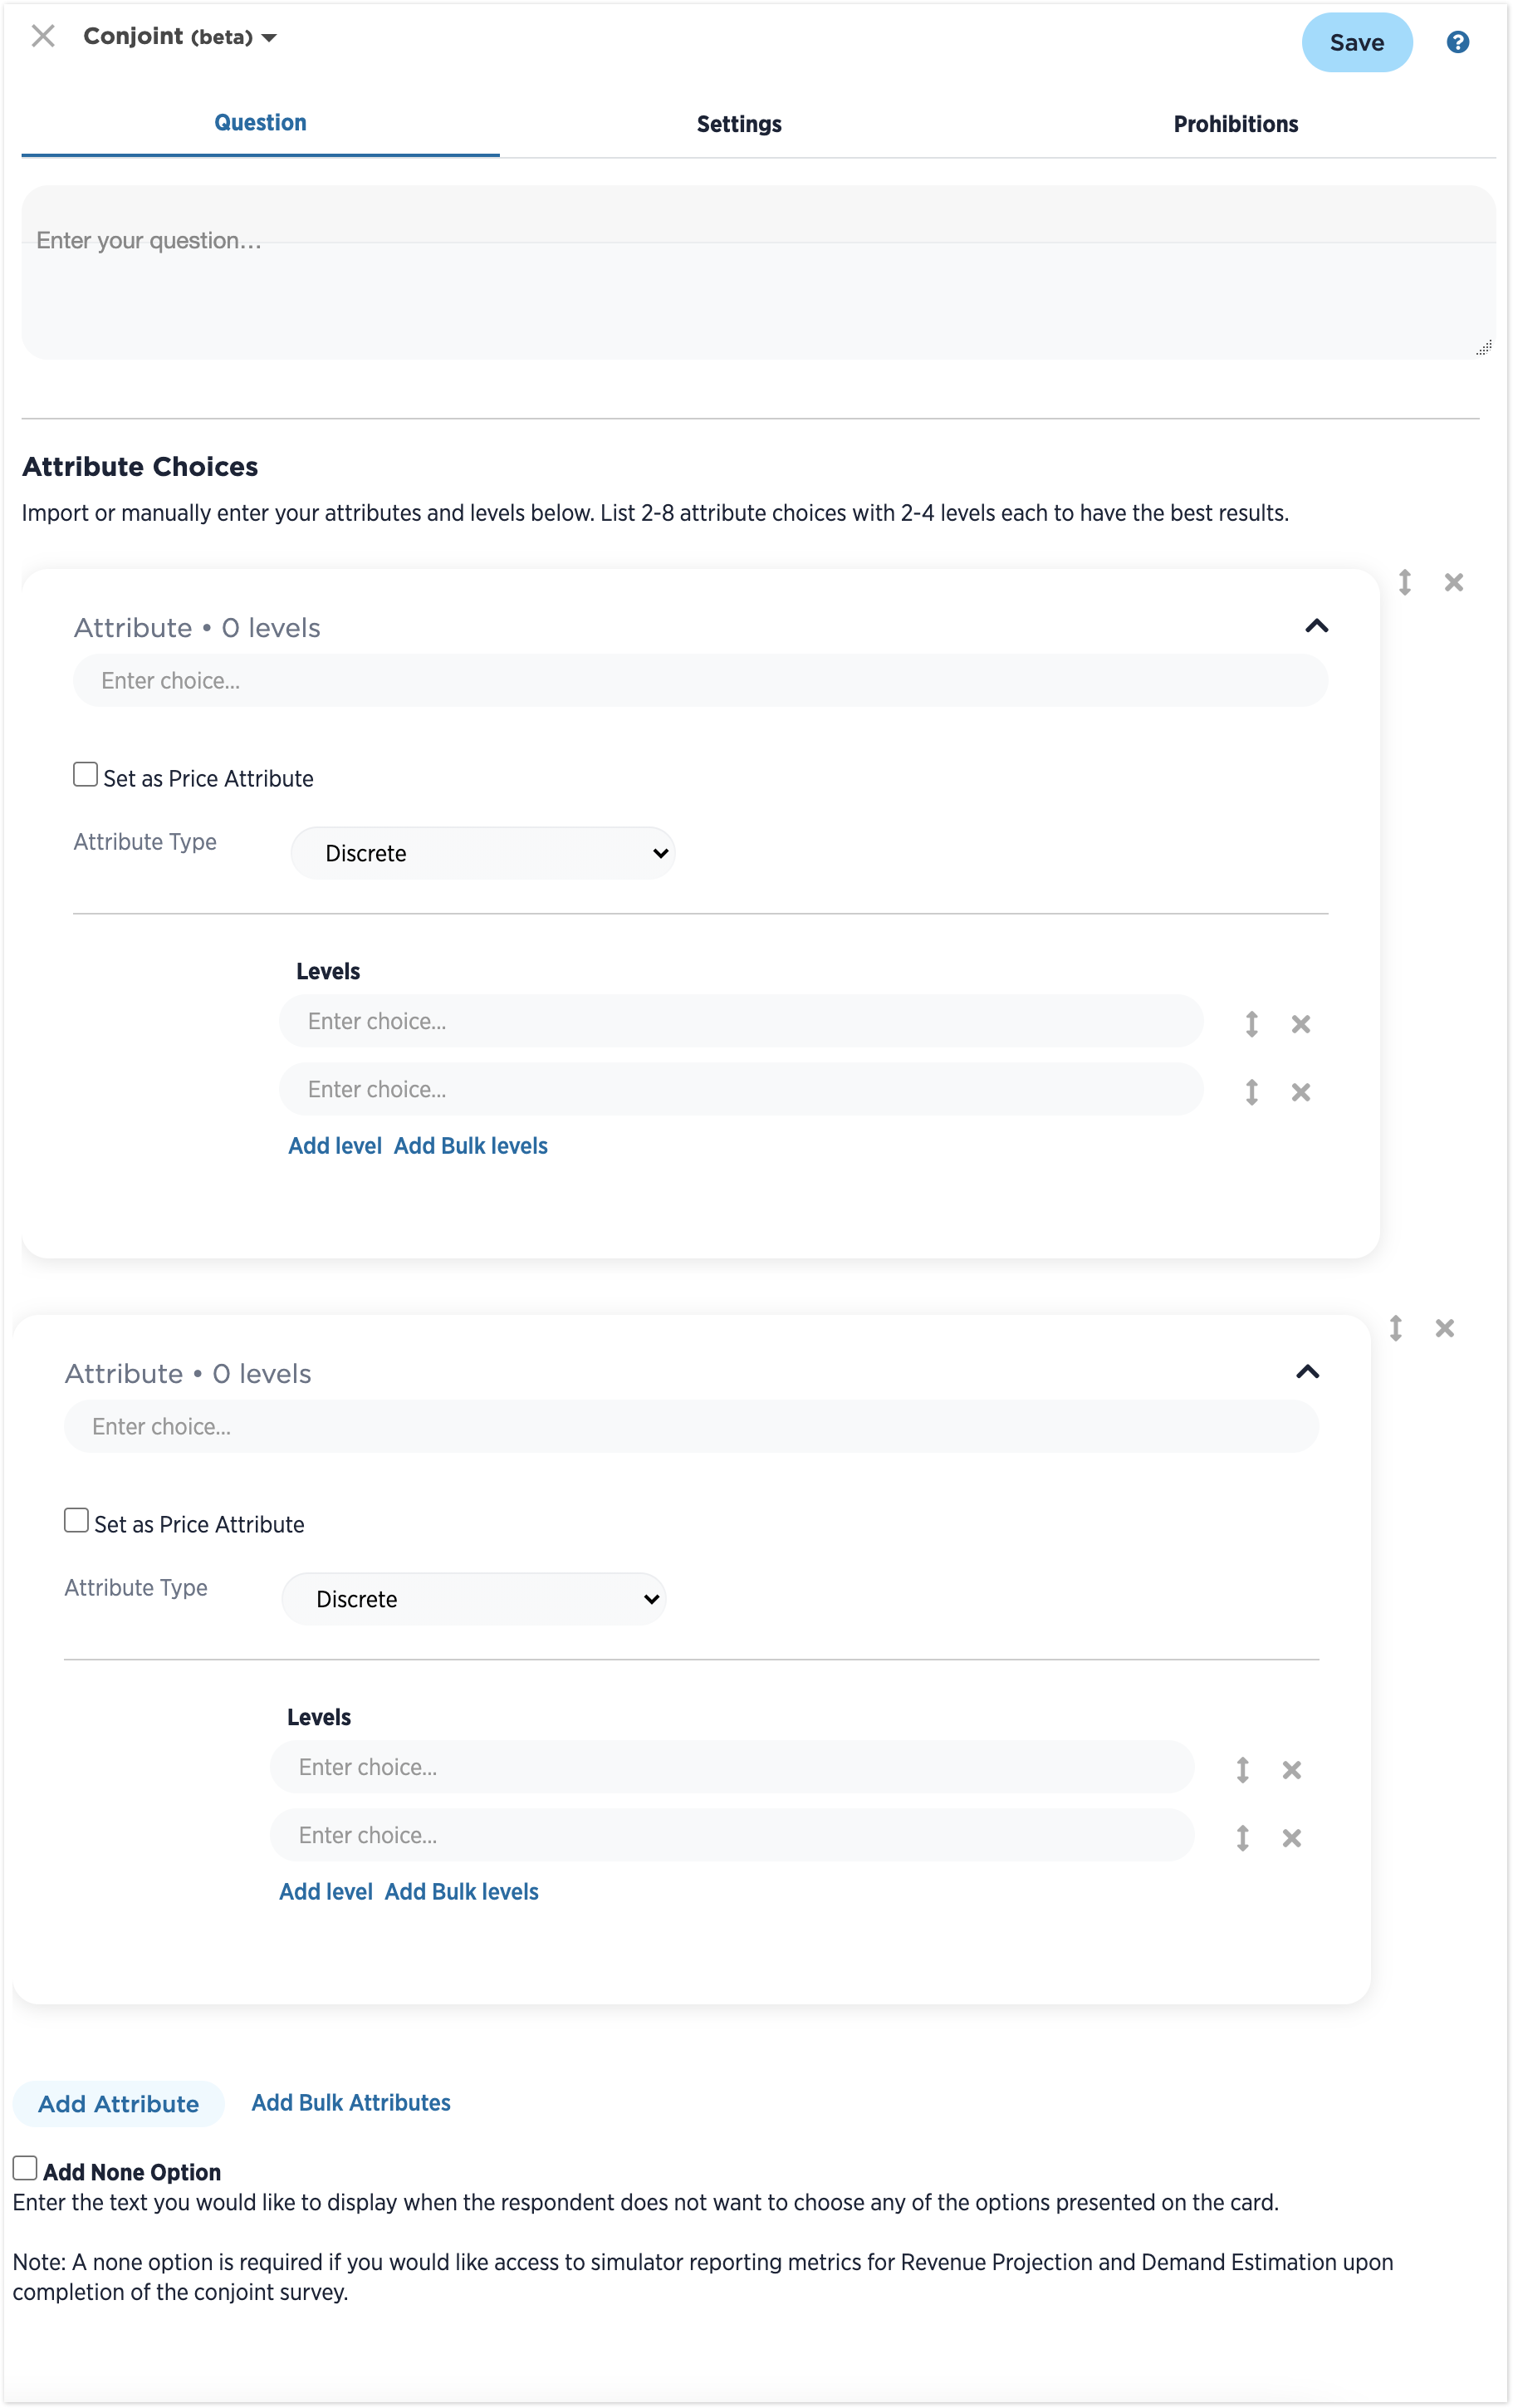
2. On the Questions tab, enter the desired question or prompt, such as “Select the option that is most appealing to you.” Then enter attribute choices for this question in the Attribute Choices section. The attributes must include the complete list of options/items that need to be part of the study for the consumer preferences along with corresponding levels for each attribute.
The default question setup includes two attributes with two levels each. A maximum of 10 attributes can be selected with up to 7 levels per attribute.
If you select the Add None Option checkbox at the bottom of this page, you can enter the text that you want respondents to see if they do not select any options presented on the survey.
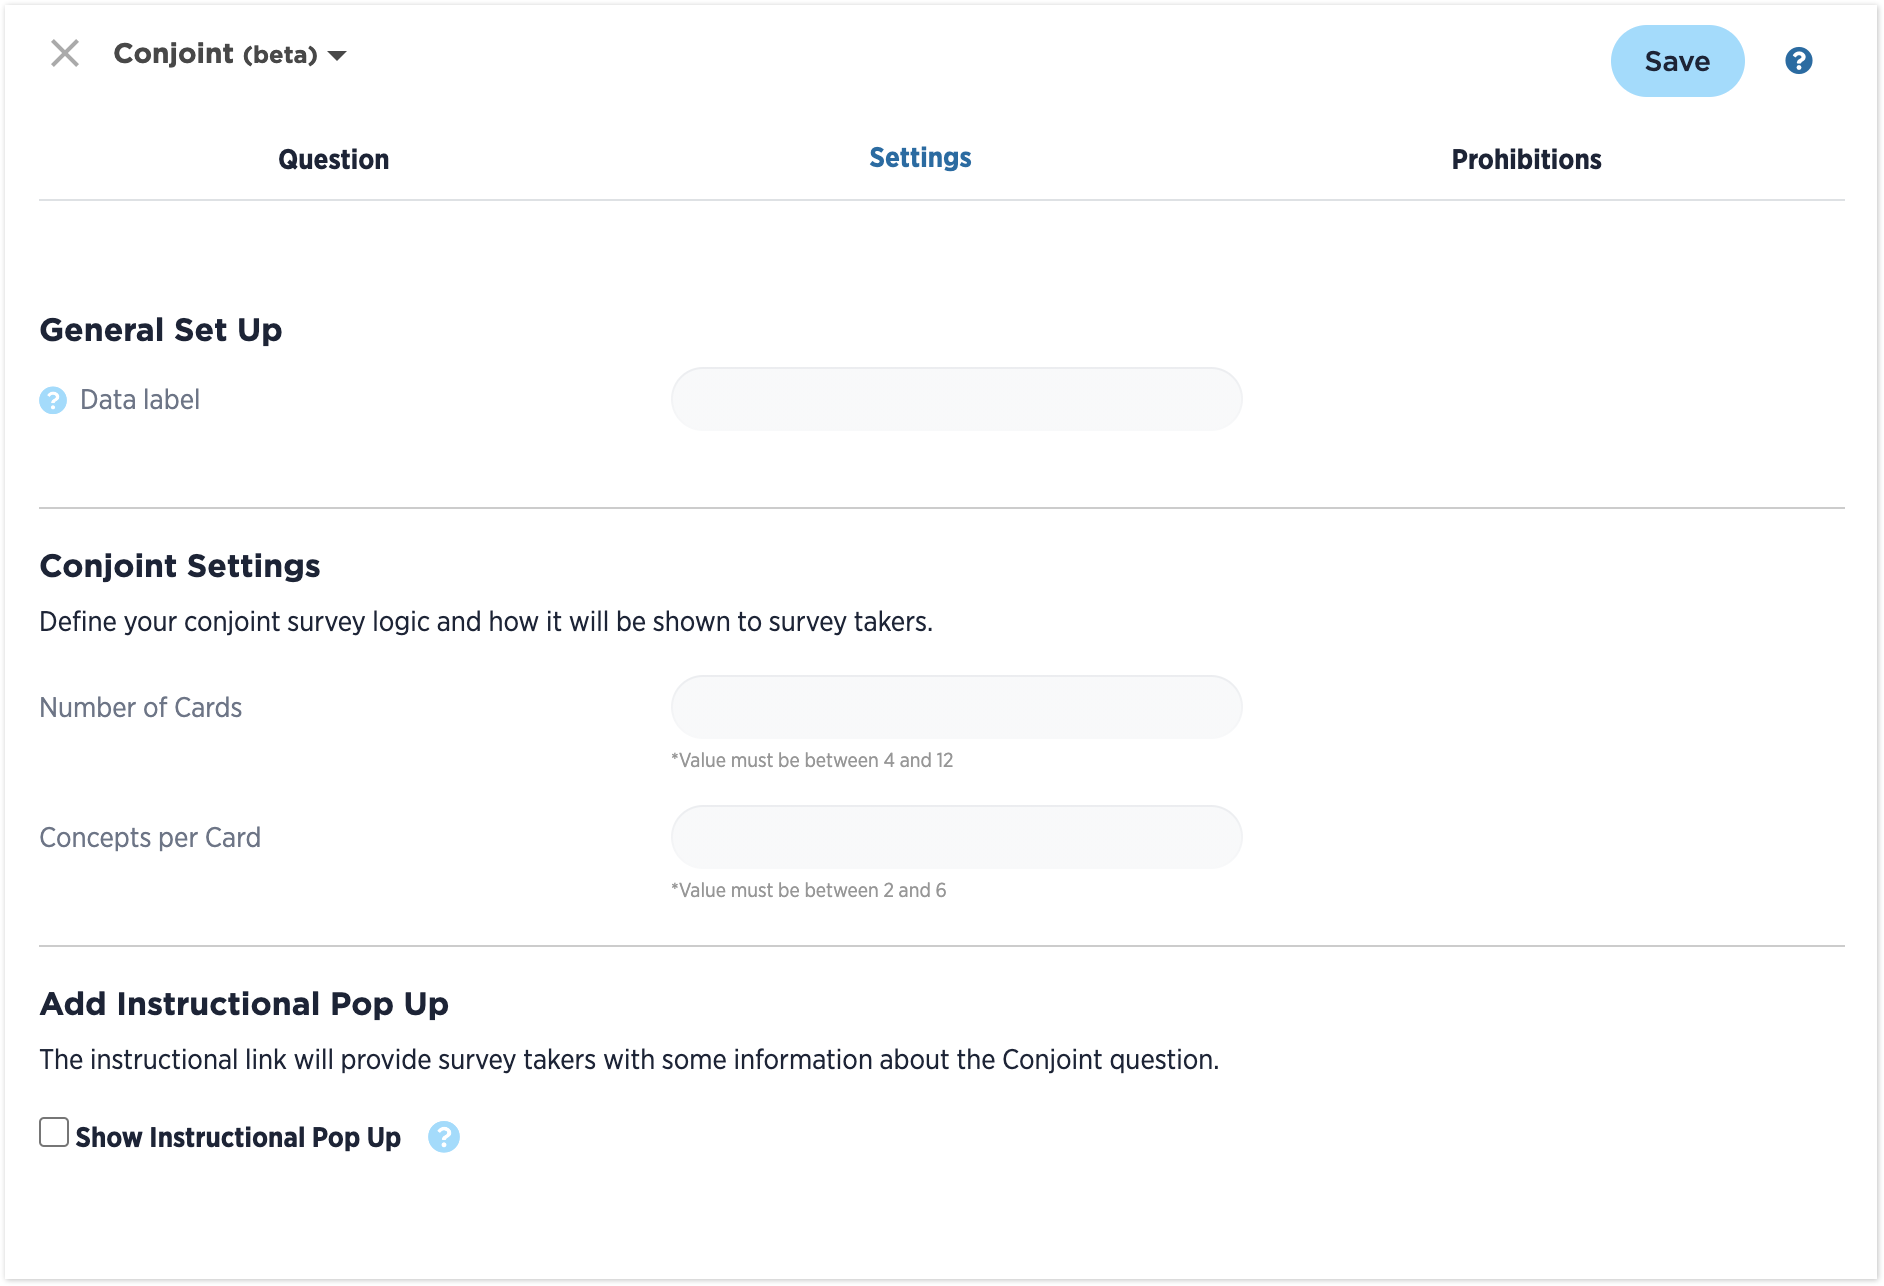
3. Select the Settings tab. The options available on this tab define the survey design and include the number of cards and the number of concepts per card for the Conjoint question. The maximum number of cards that can be displayed throughout a Conjoint survey is 12 cards. On each card, up to 6 concepts per card can be displayed.
Select Show Instructional Pop Up in the Add Instructional Pop Up section to include an instructional pop up, which will displayed as a clickable link underneath the question on each page. First, enter the text you would like to be displayed as the instructional link. Then, enter the instructional text you want to pop up as a result of clicking the link.
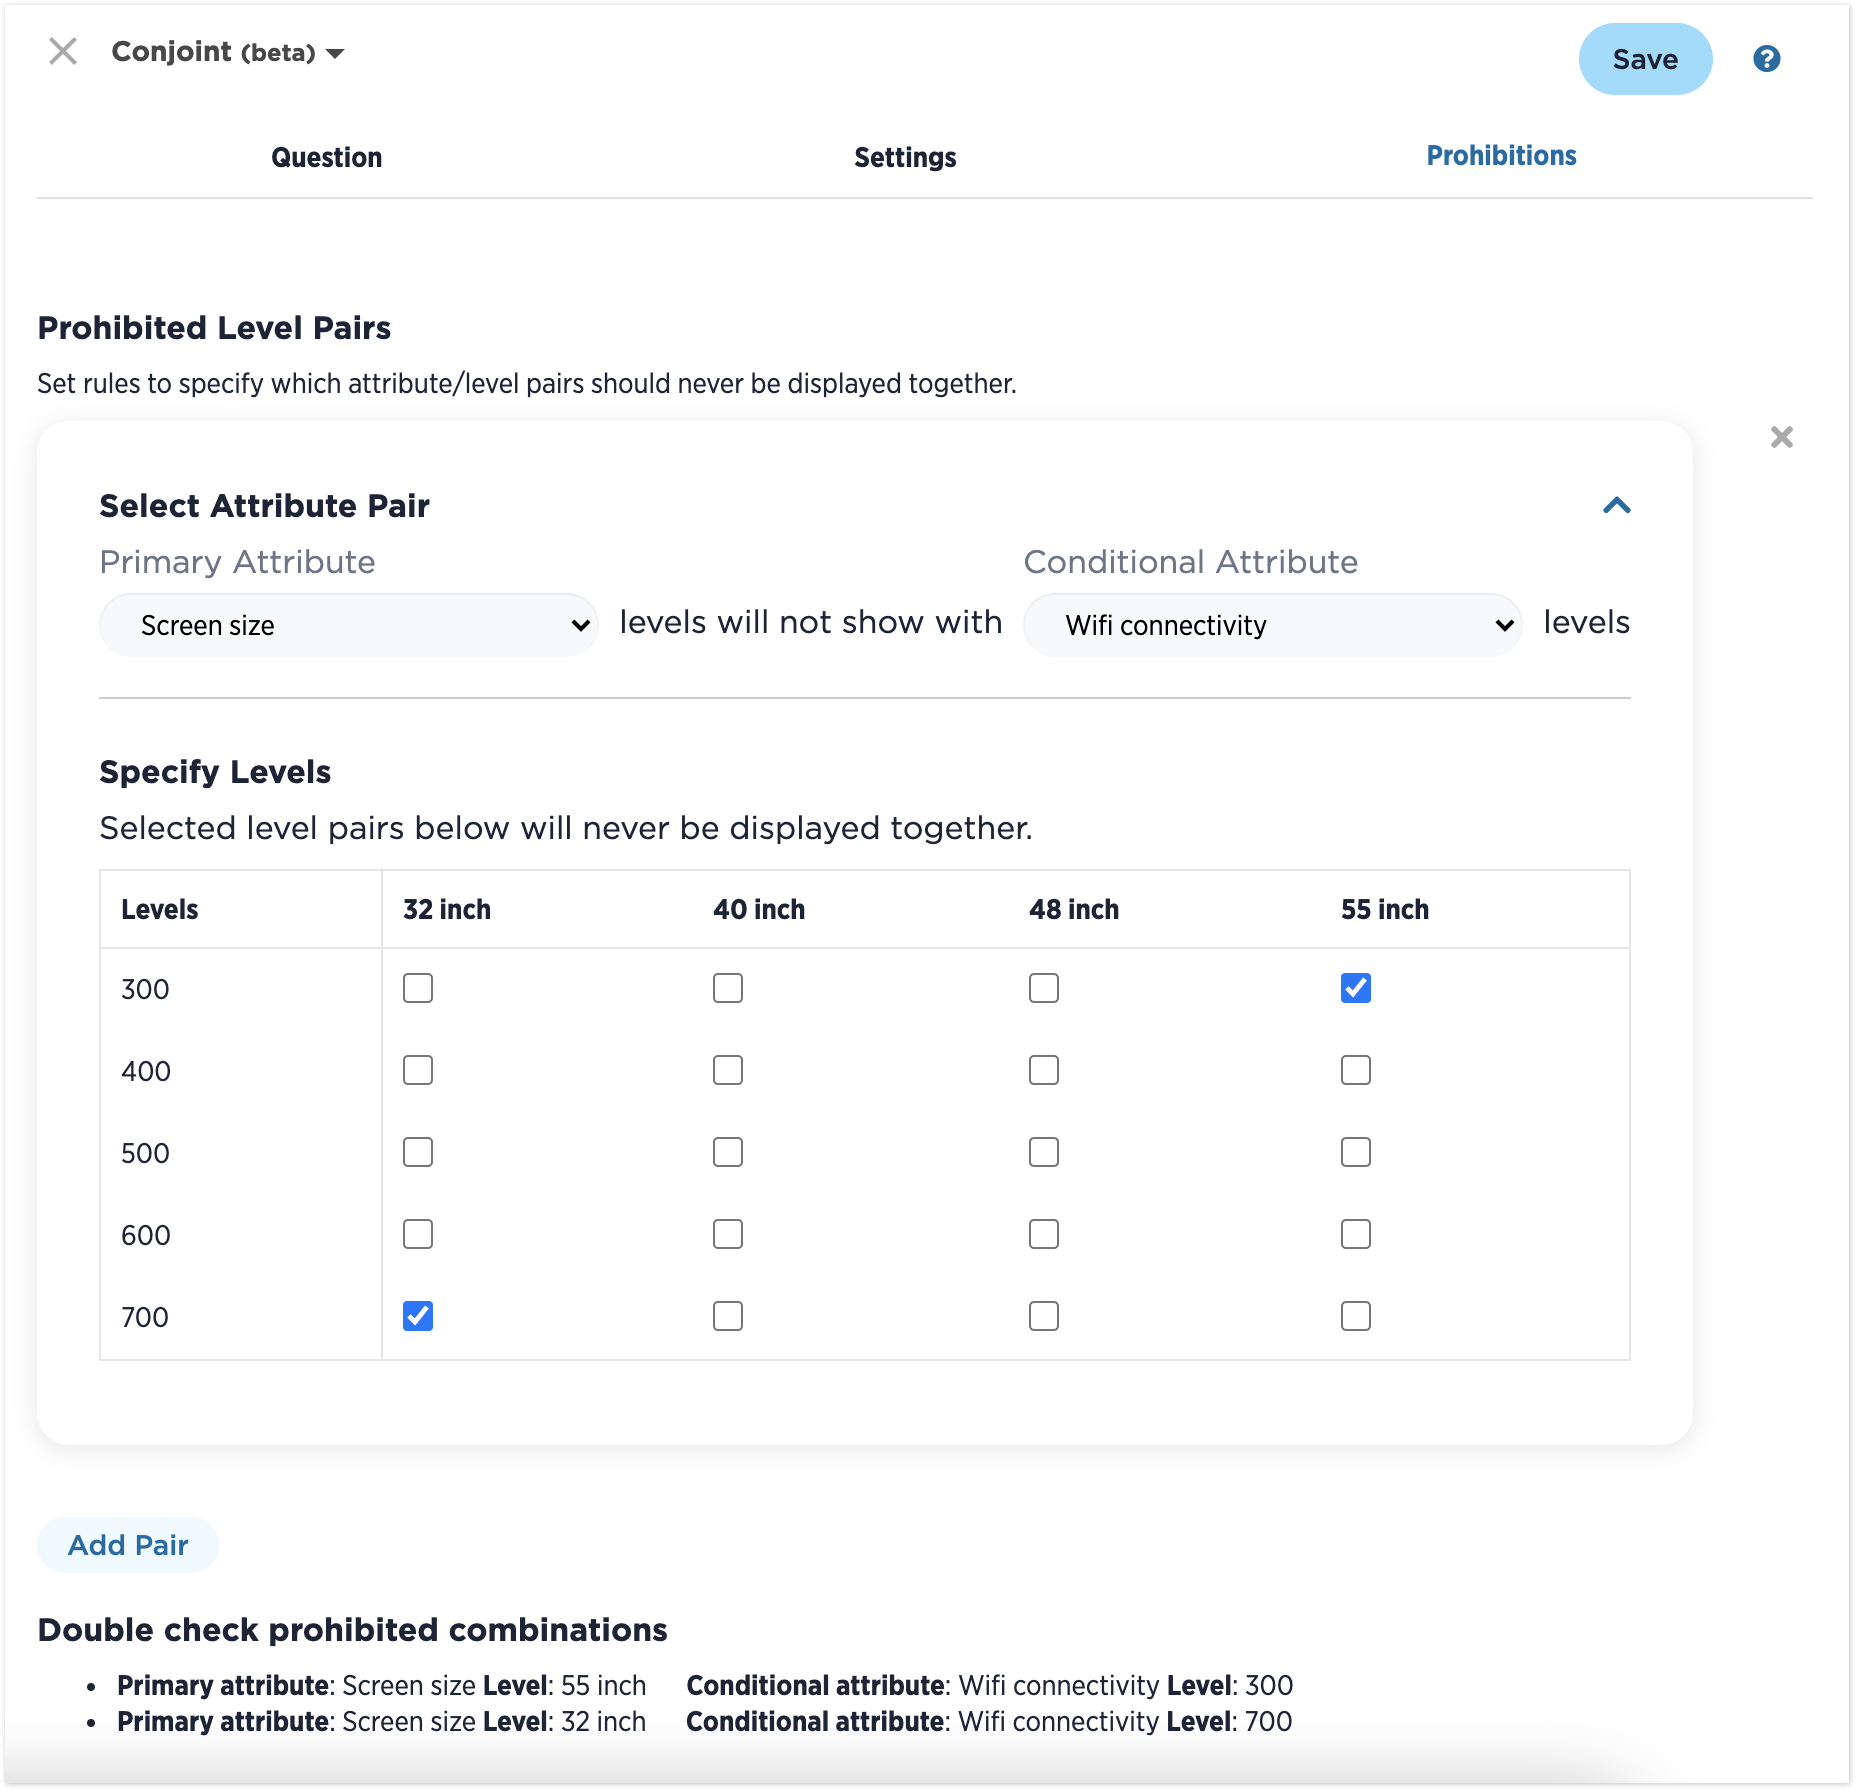
4. Select the Prohibitions tab. The options available on this tab allow you to set specific rules that prohibit the selected attribute’s levels from being shown to respondents on a card. For example, you would never show the model “iPhone 13” with the brand “Samsung”. Select attributes from the Primary Attribute and Conditional Attribute dropdowns. A grid with all the levels for each attribute will then be displayed, where you can select the combinations of levels that should never appear together in a concept card.
5. Click Save. A sample version of the Conjoint question is shown. The survey design will begin processing, and you will receive a notification once the design has been fully processed and the survey is ready to be launched.
Select Settings in the options menu to configure survey appearance and various other elements, including survey language. Language support and translations for Conjoint are available.
Experimental Design
The experimental design is a critical component of Conjoint as it reduces the full range of possible combinations of attributes and levels to a statistically representative set. The design determines the layout of each card, including which attribute/level combinations will be shown in the questions that respondents see.
The experimental design ensures balance and orthogonality; each level is shown an equal number of times (balance), and each level of every attribute is shown an equal number of times with each level of other attributes (orthogonality). The designs generated are D-efficient designs that ensure accurate unbiased estimation of main effects.
Conjoint Simulator
The Conjoint Simulator allows you to see how respondents may react to different product and service offerings. To access the Conjoint Simulator, select Analyze from the options menu.
Note: The Conjoint Simulator section only appears if the survey contains a Conjoint question and is only available if the survey is closed and all data is processed.
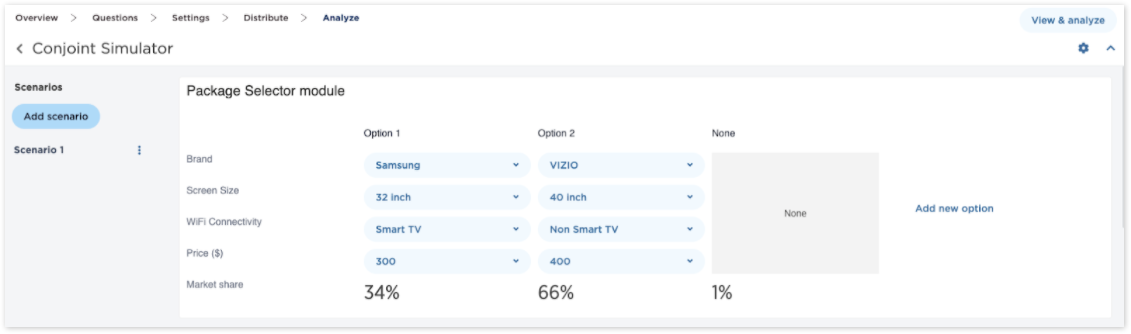
Select up to 20 different product offering combinations, customizing each option based on the attribute and its corresponding levels that were analyzed as part of the Conjoint survey. The Conjoint Simulator uses the data collected from the survey respondents to provide insights about the particular options you have selected.
This simulation reporting allows you to compare options to understand preference share, feature importance, revenue, projection, and demand estimation.
- Preference Share: This report uses a bar chart to illustrate the total preference/utility being created by the package that is being tested in the simulator. The higher performing a package is for your customers, the more preference share it will control. This will be reflected as a higher percentage in the bar graph.
- Feature Importance: This report uses a stacked bar chart to illustrate the amount of preference share being contributed by each of the individual features. The greater the feature importance score is for an option, the more it added to the option’s preference share in comparison to the other features.
- Revenue Projection: This report displays your projected revenue for selected product offerings at each price point. This graph is only available if the Conjoint question contains a “none” option and a price attribute.
- Demand Estimation: This report displays how your preference share (demand) is affected by price/price variation. With this graph, you can determine when your price or price multiplier is getting too high and affecting demand. This graph is only available if the Conjoint question contains more than one option and a price attribute.
After running the Conjoint Simulator, you can download the results to a PDF or Excel file and can share the data externally via a hyperlink that the simulator generates.
Conjoint Summary Report
Reporting element “Conjoint Summary” is added by default to the Smart Report and can be added to the Blank Reports when you use a Conjoint question in a survey. This reporting element will present the preference share for conjoint attributes and levels. See Add a report element for additional details.
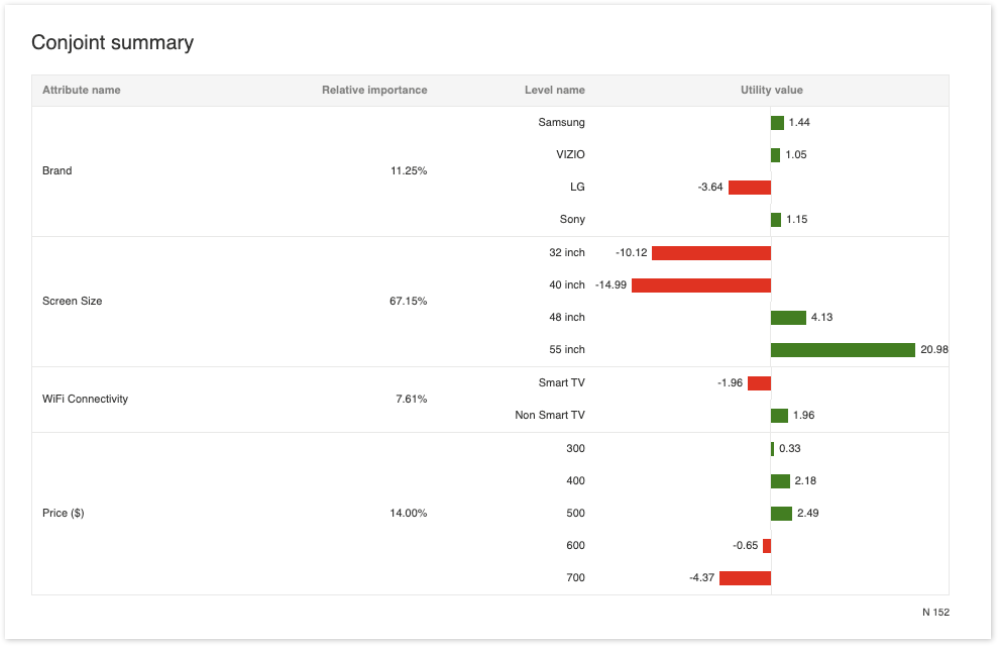
This view can be edited to include metrics around the relative attribute importance and utility value of each attribute/level combination. When you change the data elements on the page, you can either export this report as an image or download the report details to view in an Excel spreadsheet.
Conjoint Details Report
The Conjoint Details report allows you to see the experimental design and versions as well as the respondent selections based on the version made available to the respondent. This includes exporting respondent level metrics (utilities, relative importance) for use in additional analysis (e.g., segmentation). This report downloads into XLS format containing Utility Scores, Raw Scores, Design, and Versions tabs.
You can download the raw data into a CSV, XLS, or SAV format to perform additional analysis if needed. See Download your results for details.
Leave a Reply