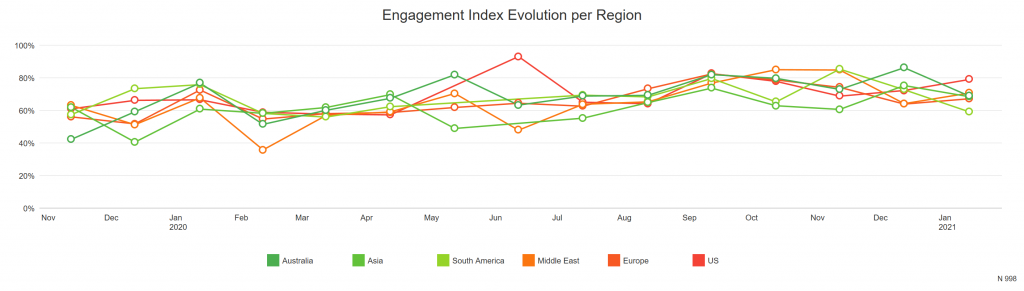
Surveys today are no longer snapshots, but stay live for longer periods of time. This is why it becomes important to see the evolution of results over time. The timeline element makes it possible to track an aggregate value over time, such as the average satisfaction, NPS, respondent count, Net Sentiment Score etc. grouped by a selected period (day, month, quarter, year, …). If you want to limit the dates covered, use a filter.
- Edit an existing report or create a new report.
- Add an element.
- In the Element type tab click on Timeline.
- Select the data source that you wish to create a timeline for.
The element is now added to your report.
Change the reporting period
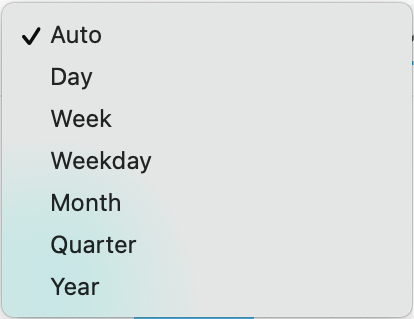
By default the timeline will show the results in the most optimal reporting period for your type of data source, be it daily, weekly, monthly, etc.
You can always change this reporting period by following these steps:
- Select the timeline element (or create a new one).
- Go to the Settings tab.
- In the Period drop-down select the desired period.
- The element will be updated immediately.
Compare multiple data sources
You can also compare two or more data sources over-time. This allows you to see, for example whether or not your company’s average satisfaction score is linked or not to the average number of issues reported to your support team.
In order to do see these results in the same chart, add an extra data source to an existing timeline.
- Select the timeline element (or create a new one).
- Go to the Data tab.
- Click on Add and select Data source.
- Select the extra data source that you want to view in the same chart as the first one.
Alternatively you can add a breakout to a timeline so that separate timeline charts are shown side by side. Each timeline chart will show the results filtered on the different options of the data source that you selected as a basis for your breakout.
- Select the timeline element (or create a new one).
- Go to the Data tab.
- Click on Add and select Breakout.
- Select the data source. The element will be updated immediately.
Leave a Reply