An element is the basic building block of a report or dashboard.
Elements inherit their settings and style from the report but these can be overridden at the element level.
Elements usually take up the full width of a report, but you can place elements next to each other by setting their width to less than 100%.
The two most important properties of an element are:
- Element type: Determines how the data will be visualized. There are several types such as charts, tables or free text. Read more.
- Data source: Provides the data that is used in the element. This can be one or more questions or it may be metadata that was passed to the survey.
When you add an element, you first choose whether to start from a data source or from an element type.
Steps to add an element to a report:
- Go to the survey.
- Click on Analyze.
- Click on ReportBuilder.
- Edit an existing report or create a new report.
- In the report, select the element after which you would like the new element to appear. Otherwise it will be added to the end of the report.
- Click on Add element.
- Select whether you wish to start from a data source or an element type (both are covered in detail below):
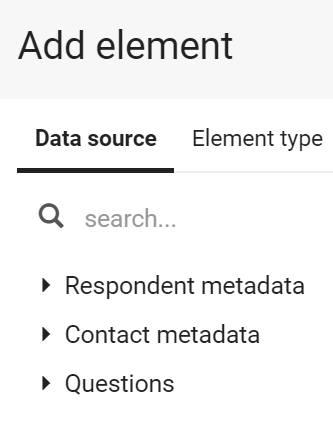
Data source
When you start from a data source, you first have to choose between the three main types of data sources:
- Respondent data: This is metadata captured about the respondent such as which channel they used, the date they answered, etc.
- Contact data: When you import contacts, either by uploading a file or through the API, you can add metadata such as: gender, date of birth, country, state and 20 custom fields. That information is now available as a data source in this report.
- Questions: These are questions you asked in your survey. Remember that you can add multiple elements for each question.
- Select the desired data source. Use the search at the top to find something faster.
- In the next step you decide how you want to visualize the data source, by selecting an element type. Only the element types that are compatible for the selected data source will be available.
Your element is now created, and ready to be edited.
Element type
Here you start by choosing the type of element you wish to create: a chart, cross-tab, word-cloud, free text, etc. The element type determines how the data will be visualized. In the second step, you select a data source compatible with the chosen type.
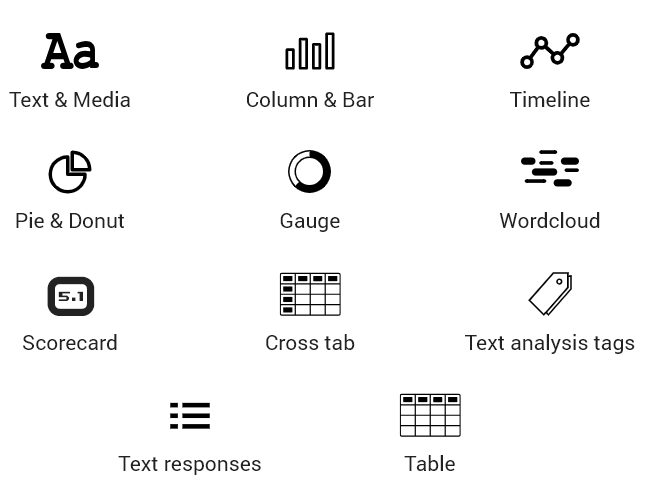
- Select the element type you want to add to the report.
- Select the data source you want to use in the selected element type. Only data sources compatible with the chosen type will be available.
Note: If you select Text/media, the element will immediately be created since there is no data source required for free text.
The newly created element is now ready to be edited.
Leave a Reply