Benchmarks are available in most element types. They are often used to compare current results to a previous period or to compare a selection of respondents to all respondents. For example, to compare the satisfaction score of different departments to the total score of the company. It is also possible to set a fixed benchmark as a goal to quickly see which departments are above and below the goal. Both types of benchmarks can be combined in the same element.
Fixed benchmark
Fixed benchmarks are useful for different purposes. One is to set a goal and then compare the results of the survey to that goal. Another reason might be to set a benchmark that comes from an external source, like an industry benchmark or from a previous survey.
Steps to add a fixed benchmark:
- Click on the element.
- In the properties pane, click on the Settings tab.
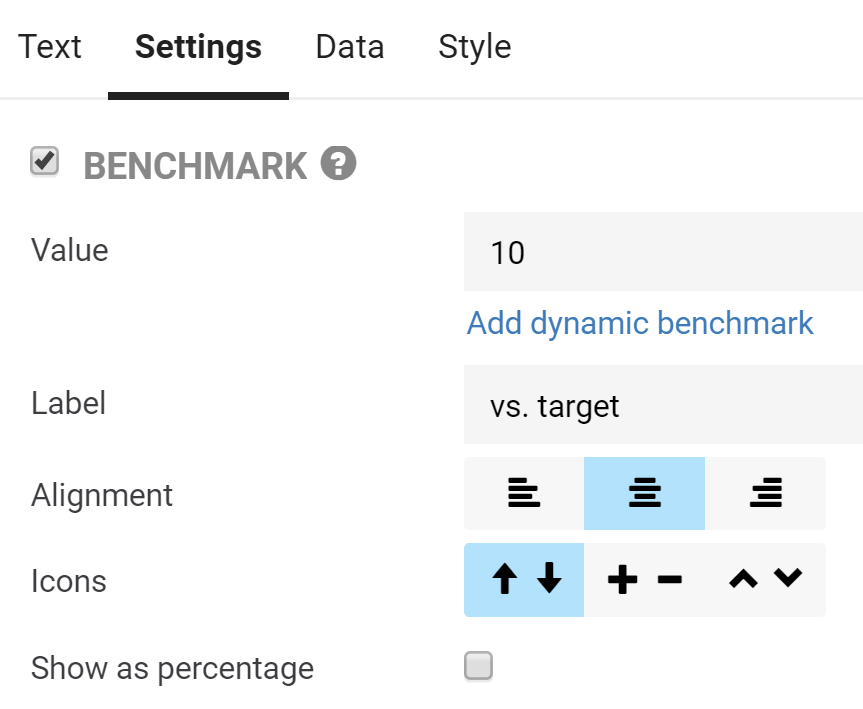
- Check Benchmark.
- Enter a number in the Value field.
- Give it Label, like ‘Goal’ or ‘Target’.
- If the element type is a Gauge or Scorecard, then select the alignment and which icons you would like to appear before the benchmark. The benchmark will be shown as the difference between the benchmark value and the value of the primary data source. You can choose to show the difference as a number or as a percent.
- If the element is a Column & Bar, then select the chart type for the benchmark and choose if you want to use this benchmark value as the base value of the chart.
Dynamic benchmark
Dynamic benchmarks are based on live data. They are used to compare different time periods or different groups. For instance, this month vs. last month or department X vs. the entire company.
Steps to add a dynamic benchmark:
- Click on the element.
- In the properties tab, click on the Data tab.
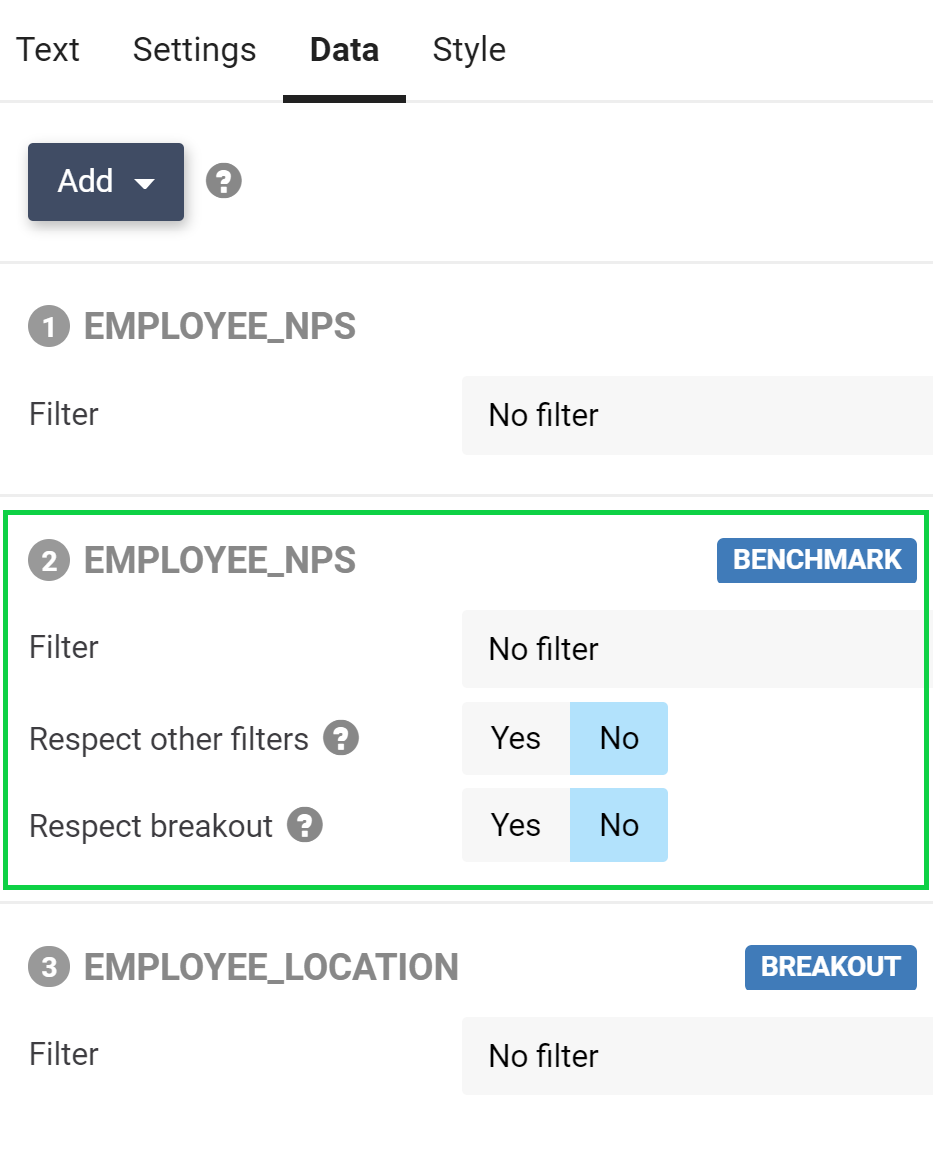
- Click on Add and then Benchmark.
- Set an optional filter for the benchmark.
- Set if you want the benchmark to respect other filters.
- Set if you want the benchmark to respect the breakout.
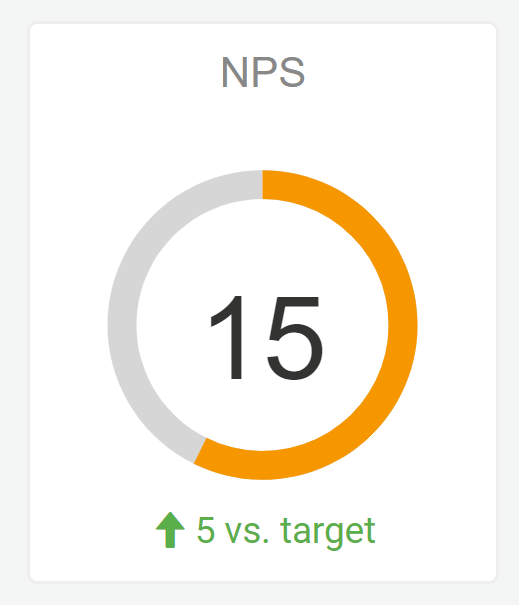
Standard single benchmark
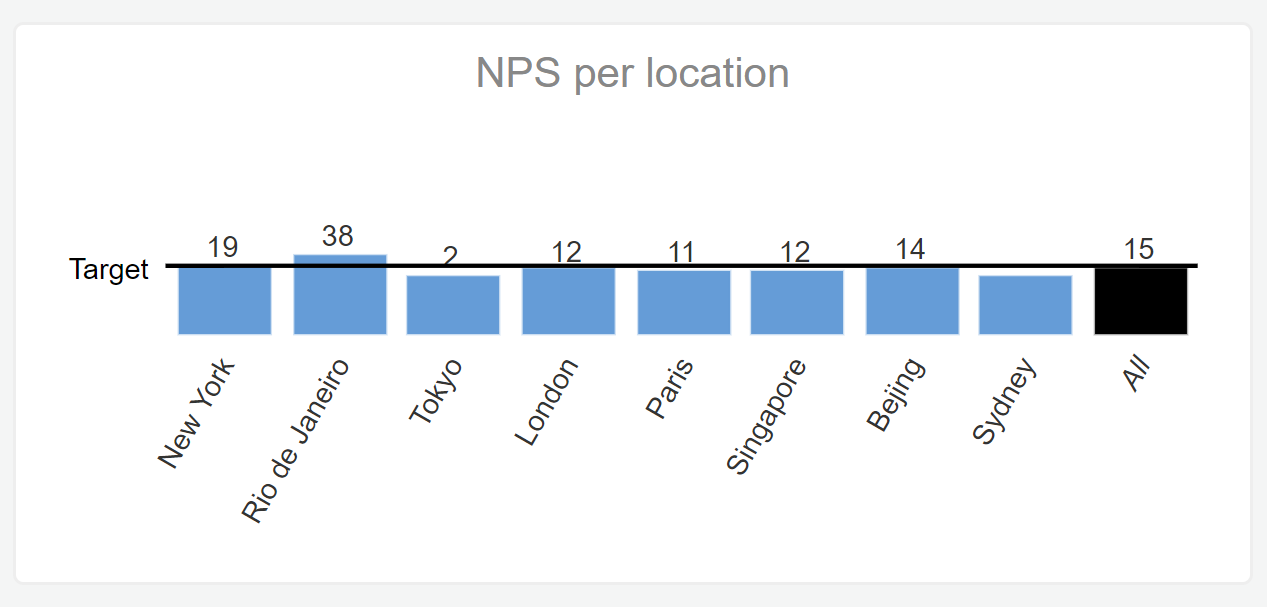
Benchmark respects breakout
Benchmarks are different from other data sources in that they do not follow filters set at report or share level. Other data sources are affected by those filters. For instance, if you create a report to share with each department of your company, then you want the shared report to be filtered to only show the data for a specific department, except of course, the benchmark for the entire company that is shown for comparison. That benchmark should not follow the filters like the rest of the report.
Dynamic benchmark settings:
- Filter: Optionally, set a filter for the benchmark. For instance, ‘last year’ or if your reporting is going to be on multiple levels, one of the in-between levels.
- Respect other filters: Normally you would not want a benchmark to respect other filters. There are some outlier exceptions which is why the option is here.
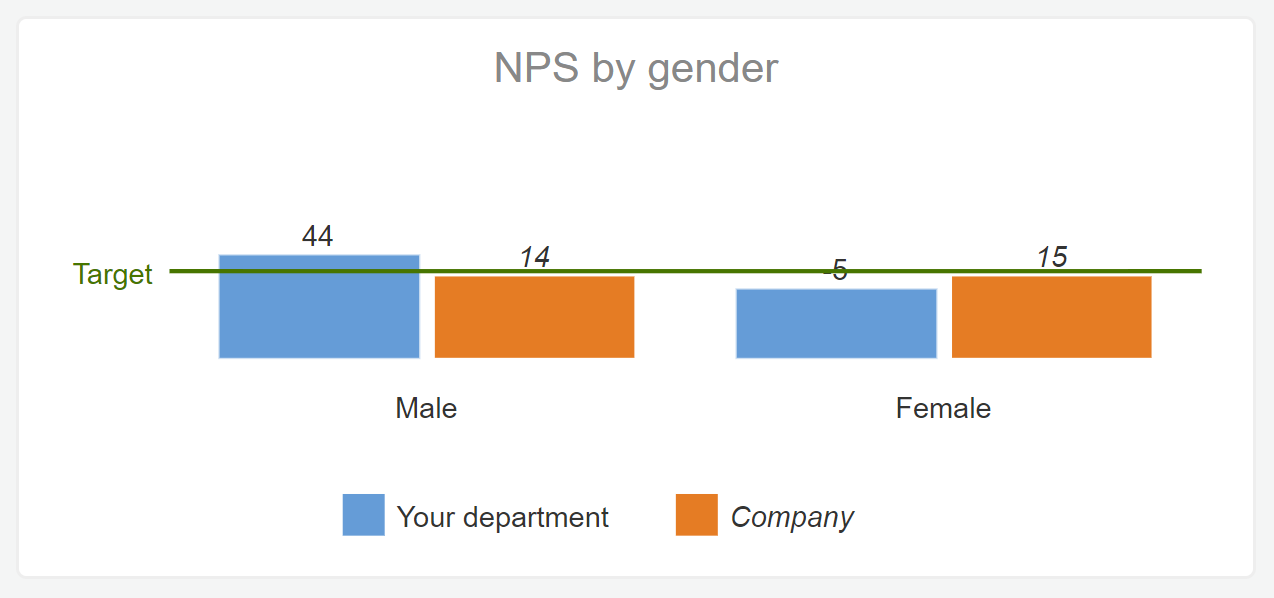
- Respect breakout: Select this option if you also want to show a benchmark value for each item in your breakout. For instance, in an HR satisfaction survey, you want to show the satisfaction for a department by gender. Then you would want the benchmark of the company to also have a breakout by gender.
The color of your benchmark can be set in the report style settings.
Leave a Reply