One of the most important insights a survey report can provide, is to show differences in your population.
To see those differences, you need to be able to compare different samples, side by side for the same question. Adding a breakout will create groups in your report element, based on a second data source. Breakouts let you do some interesting things:
- compare the NPS scores for different store locations
- compare the satisfaction score of employees by department, often with a benchmark for the whole company
- Breakout purchase intent by age category
To create a breakout, you start by adding an element such as a bar chart or gauge for a question, e.g. a satisfaction question or NPS. Then add a breakout as a second data source, e.g. ‘locations’, ‘gender’, ‘dept’, etc. The system will create a bar or gauge for each item in the second ‘breakout’ data source.
Add a breakout to an element
- Go to your survey report (or create new one).
- Select the element you wish to break out (or add a new element first).
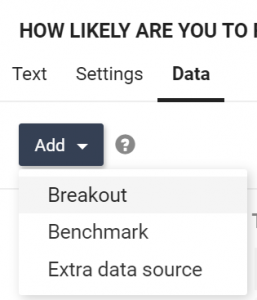
- In the properties pane, go to the Data tab.
- Click on Add.
- Select Breakout.
- Select the breakout source (question or metadata).
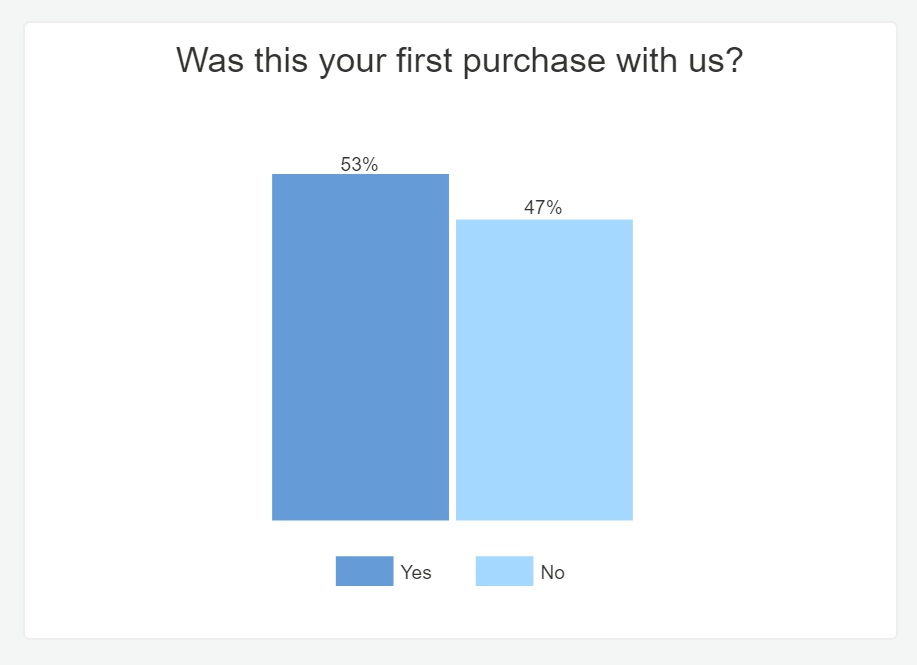
Before
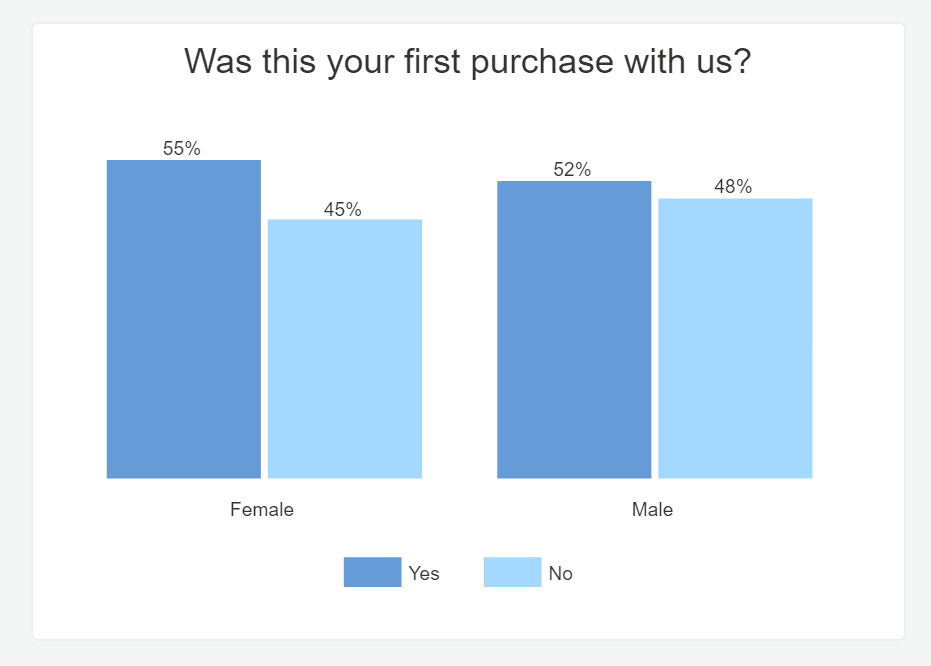
After
Breakout or breakdown?
The terms breakout and breakdown are often used interchangeably, but they have very different meanings.
- Breakout: Take a data source and break it out by another data source. A breakout always has more than one data source.
- Breakdown: Take one data source and break it down into its options. For instance, take a satisfaction score and instead of showing its average, show the response percentages for each answer option.
Sometimes, the two are combined. For instance, if you ask respondents about their last vacation, applying a breakdown in a bar chart, would produce a bar for each answer option, showing the percentage of respondents that gave that answer.
Adding a breakout based on gender, would produce two charts next to each other, so that you can easily compare the two sets of data.
Remove a breakout
- Select the element from which you want to remove the breakout.
- In the properties pane, go to the Data tab.
- Click on the trash can next to the data source that says ‘Breakout‘.
Watch the following video to see a demo of how to create a breakout element and add it to a survey.
Leave a Reply