Add a filter bar above your report and viewers are going to love how quickly and easily they can filter! As they click, the data adjusts in real time!
You choose the filters
You have total control over which criteria viewers can filter. You can select both questions and meta data. You can choose the order in which they appear and which label is used on the filter bar.
Multiple filters at the same time
Viewers can set multiple filters at the same time. For instance, if a viewer selects ‘last year’ from the ‘date’ dropdown and ‘AMEA’ for the ‘region’, both filters will be applied to the report!
Filters respect the filters
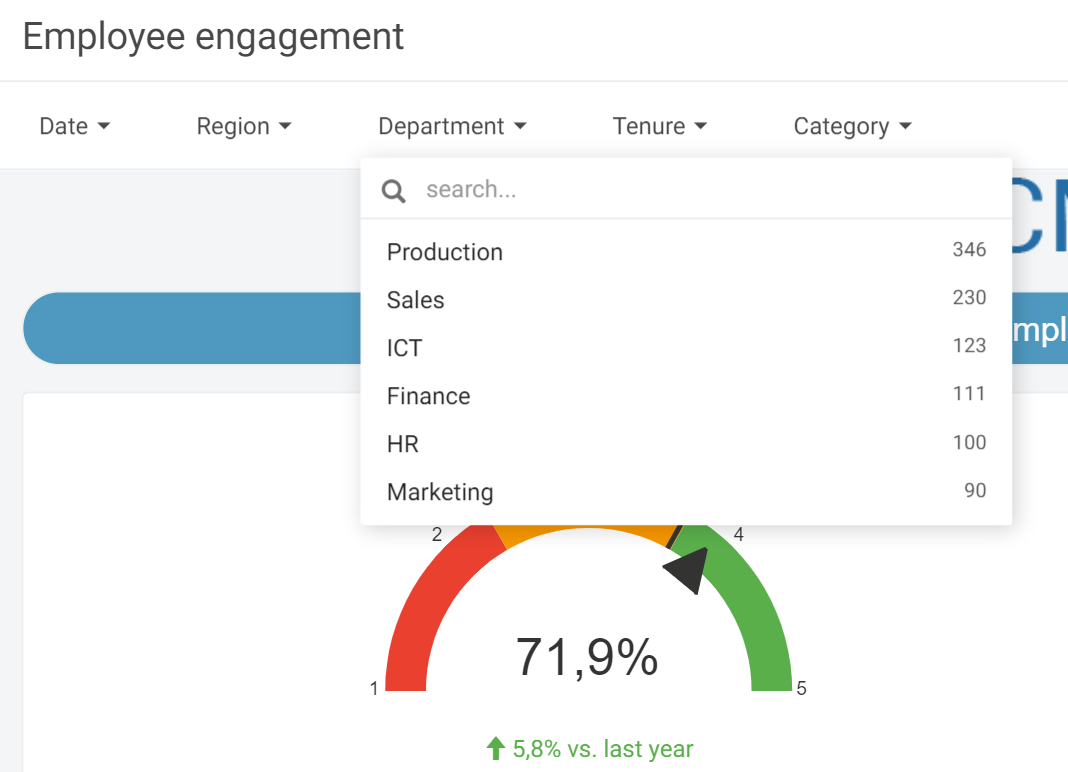
For instance, in an HR survey report, a viewer can select a ‘department’ and then the next filter for ‘managers’ will only show managers that are in that department including the number of respondents.
Add filters to the filter bar
Before you are able to use the filter bar in the Viewer, you need to make these filters available via the Viewer settings:
- Go to the ReportBuilder and edit your report.
- Click on the cogwheel
 at the top right and select Viewer.
 - Go to the Filters tab and tick the box next to Filter bar to activate it.
- Click on Add criteria.
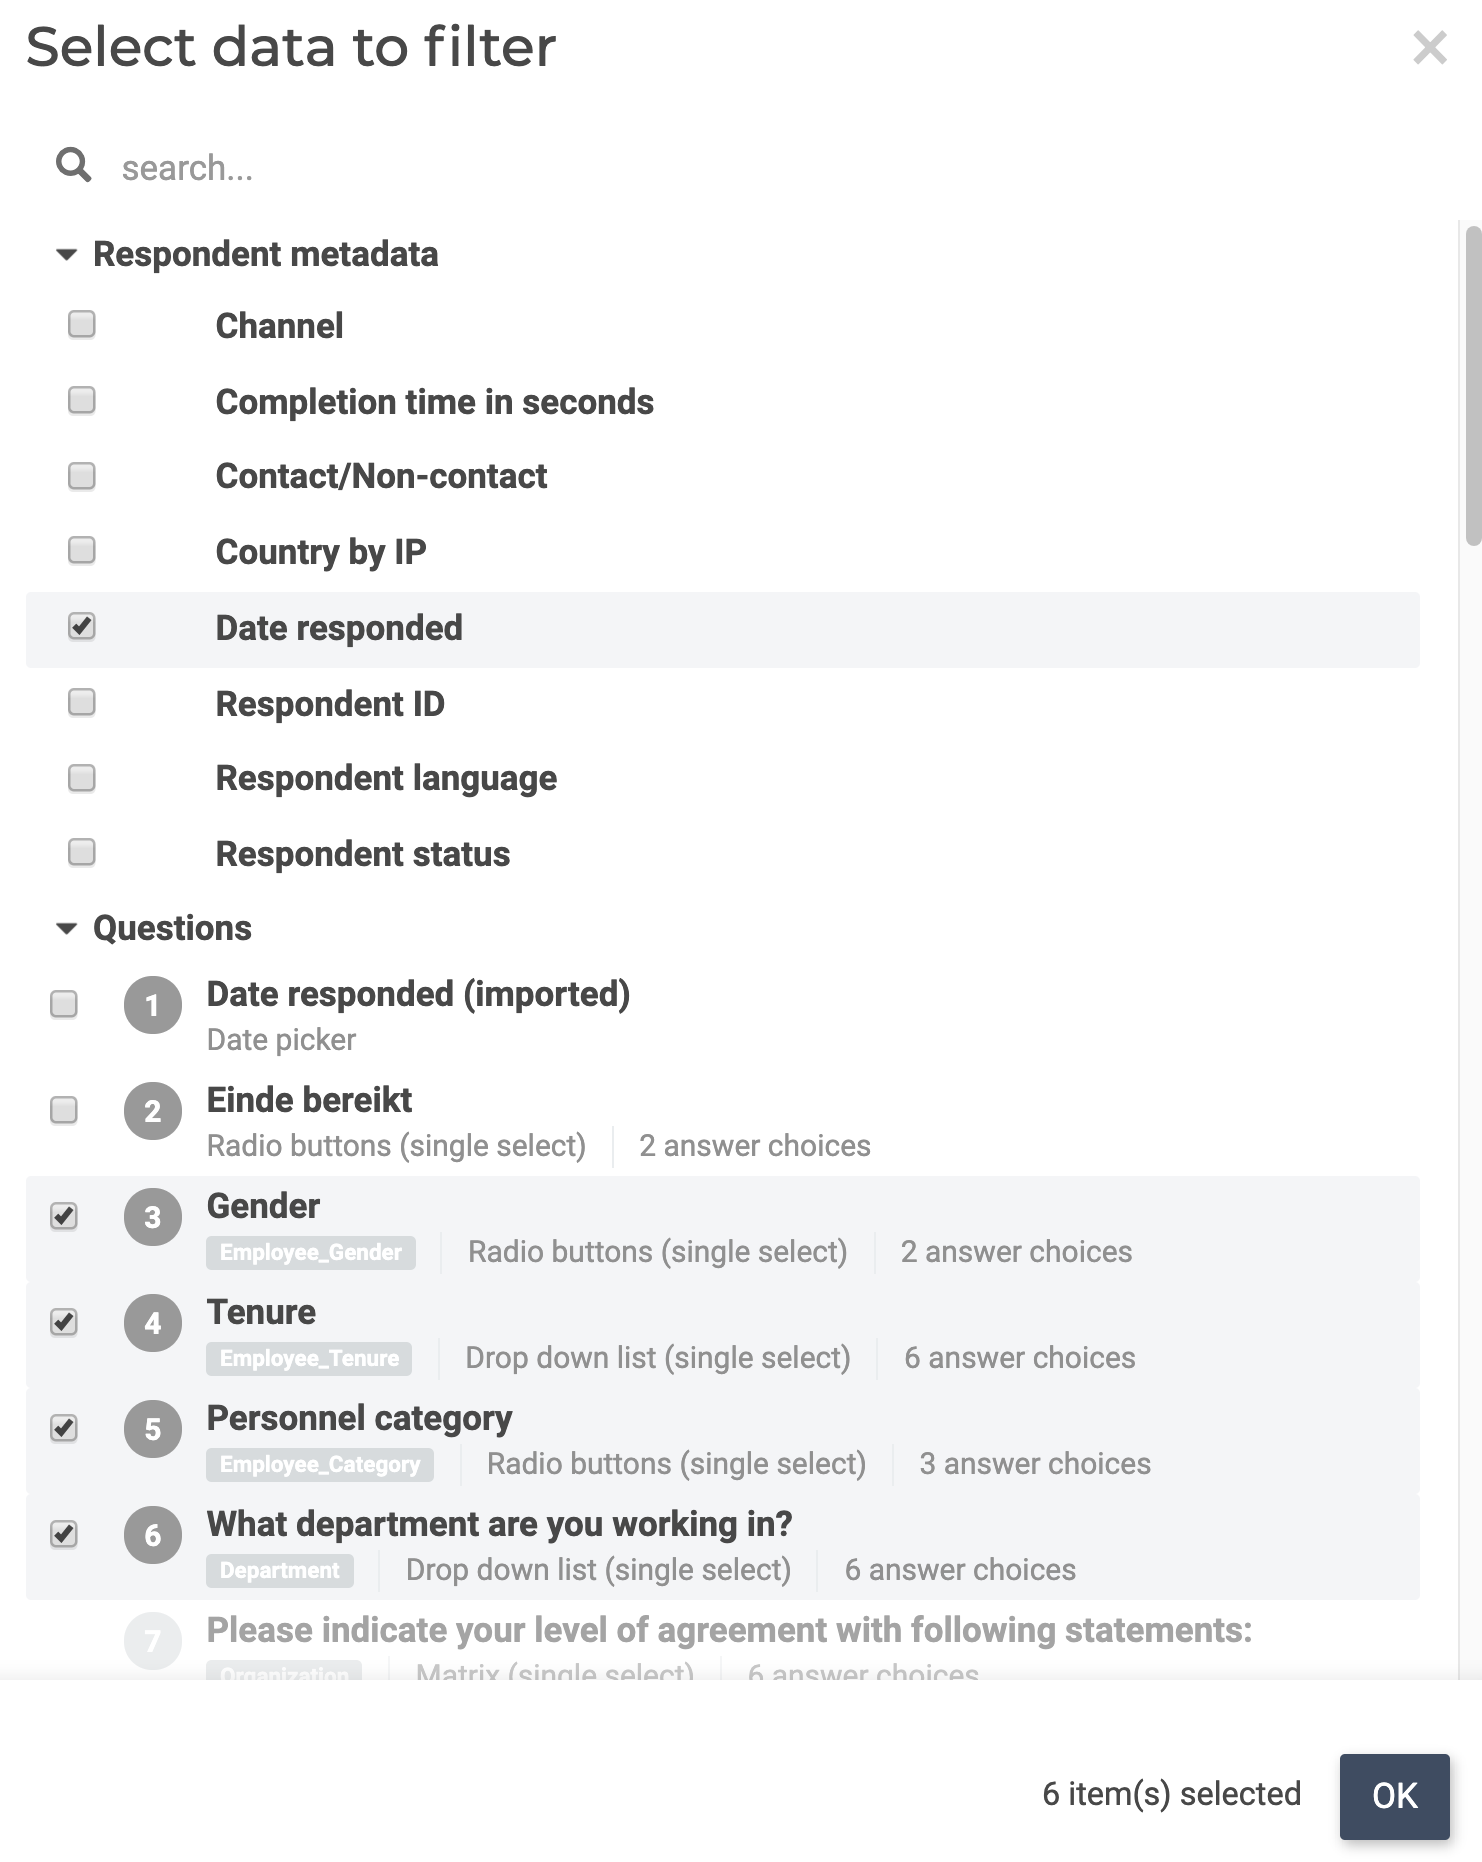
- Select the items that you want to make available on the filter bar:
- Respondent metadata
- Survey questions.
- Click OK to apply.
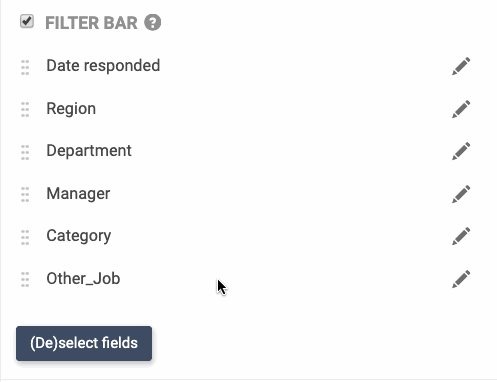
Renaming filter bar items
You can change the label of the criteria as it is shown on the filter bar to viewers of your report.
For instance, you may have question in the survey that reads:
“How long have you been working for ACME?”
That is way too long for the filter bar. You should edit the criteria label to be only:
“Tenure”
To change the label, click on the pencil next to the criteria that you want to change.
We recommend keeping the labels very short, one or two words at most.
Change order of filter bar items
You can adjust the order of the items in the filter bar. Try to give the filters a logical order. If there is a hierarchy in your organizational data, put the filter bar items in that order. For instance, ‘Region’ > ‘Department’ > ‘manager’. Since the filters automatically respect the filters that are already set, once a report viewer has chosen a region and department, then the ‘manager’ filter will only show managers in that department in that region.
In the Filter bar section, click and hold the handle in front of the item, then drag it up or down to position it on the filter bar.
Viewers can add their own filters
Once the filter bar is active report viewers can easily add extra criteria to the filter bar, simply by clicking on the plus button. This makes it a lot easier and faster to filter a report.
- If you view a report as a logged in tool user, items you add to the filter bar will be added for everyone viewing the report.
- If you view a report share, the extra filter bar items are just for you.
Leave a Reply