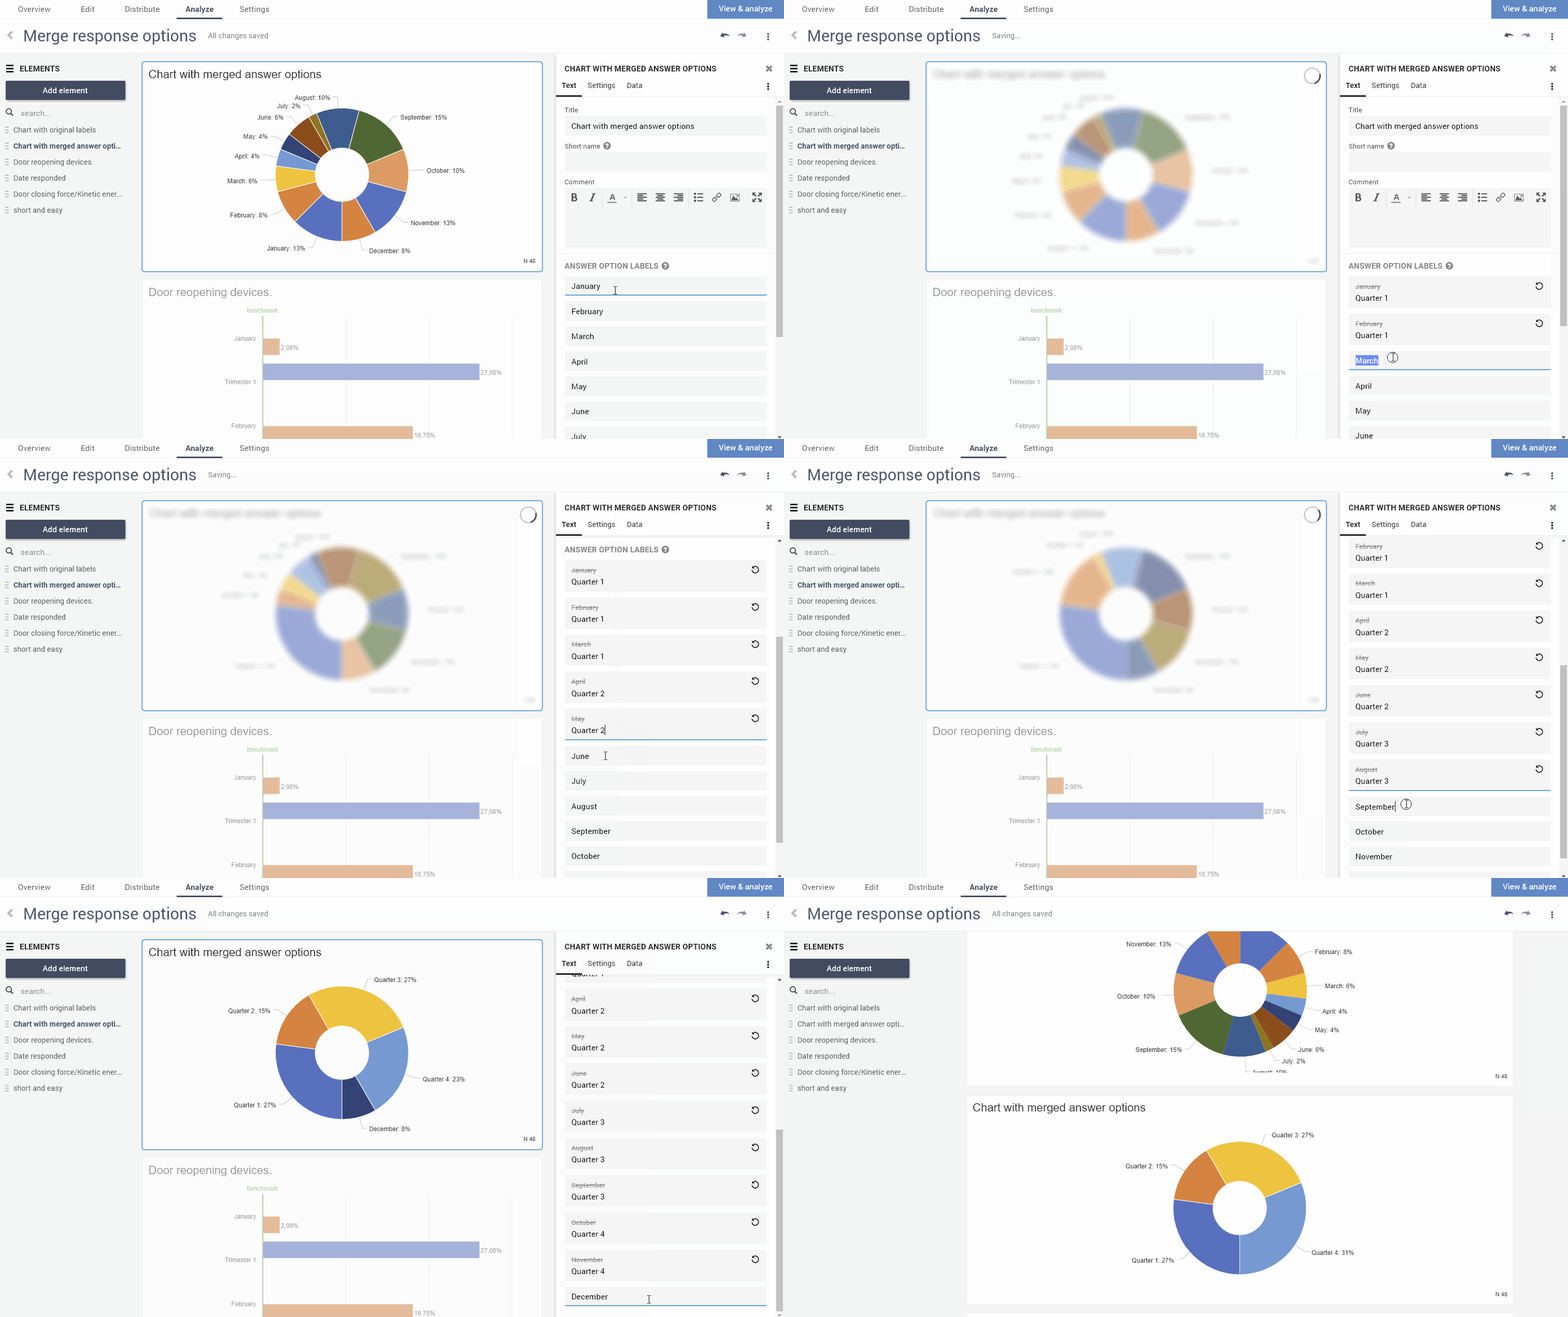
You can combine and merge answer options, presenting them as one in a report element. To do so, simply give the answer options you want to group together, the exact same label. This will combine the results of those answer options and show them together under one unified label. This does not alter the underlying data or survey question.
Example
This is often done to reduce the number of items on a scale. For instance if you have the following 5 point scale:
- Very bad – 50 respondents
- Bad – 30 respondents
- Neutral – 10 respondents
- Good – 60 respondents
- Very good – 80 respondents
To get this down to a simple 3-point scale, give some items the same label to group them, e.g. as follows:
- Very bBad
- Bad
- Neutral
- Good
- Very gGood
Now your chart will only show three items:
- Bad – 80 respondents
- Neutral – 10 respondents
- Good – 140 respondents
No changes are made to the underlying data or question. This will only affect the current element.
Steps to combine answer options
- Click on the element you wish to edit. The properties pane will open.
- In the Text tab, look for Answer option labels.
- Relabel the items that you wish to merge together, giving them the exact same label.
- The element will automatically merge these answer options into one under the unified label that you gave them.

Leave a Reply