Text analysis of survey responses
Transform unstructured open responses into quantitative data and gain insight using survey text analysis.
Try for free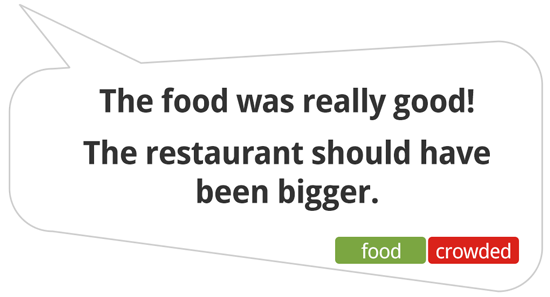
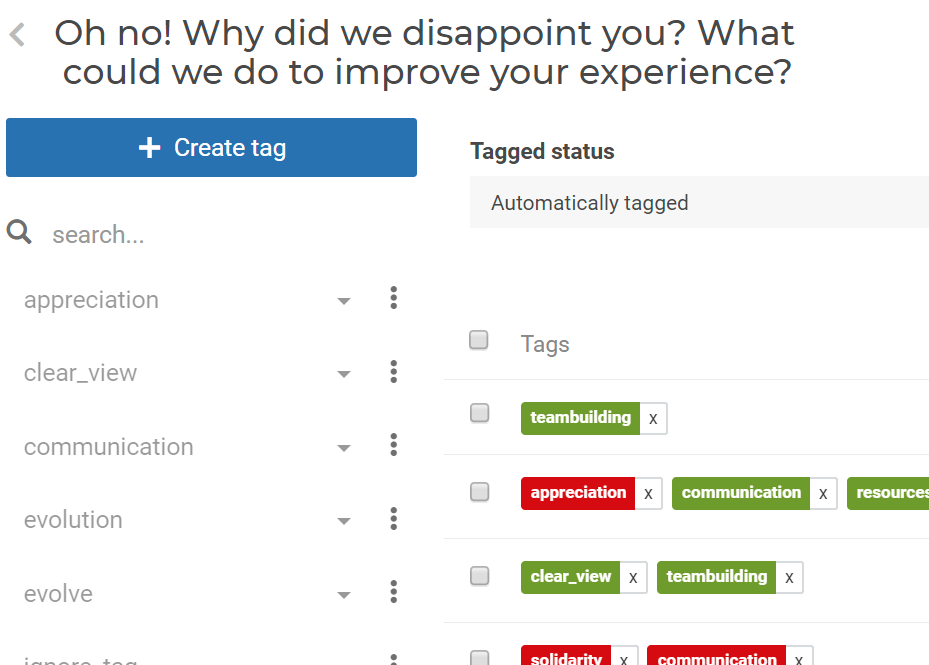
Use tags to quickly group responses into categories. Apply sentiment (negative, neutral or positive) to identify the underlying feeling.
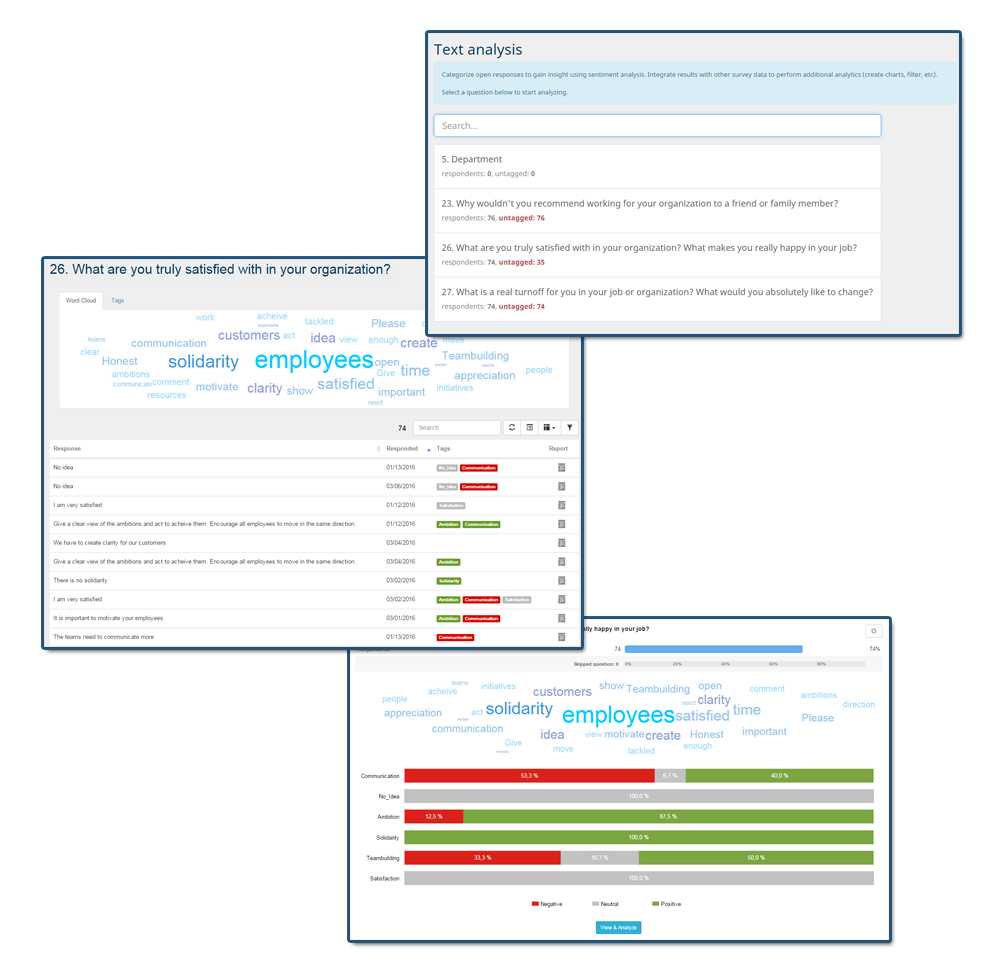
Beautiful and clear charts show you how the categories stack up. Since open text analysisis integrated in our standard reports, you can, for example, click on a category or sentiment to filter and see what impact it has on your satisfaction score. Tagging even works across multiple languages!
Start to analyze your open answers now
Open text analysis is a free feature, available for all plans.
- You can easily create tags or modify existing ones: add tags from other questions, merge tags, translate tags, remove tags, … .
- Activate sentiment analysis: determine the attitude of responses by adding sentiments (positive, neutral, negative).
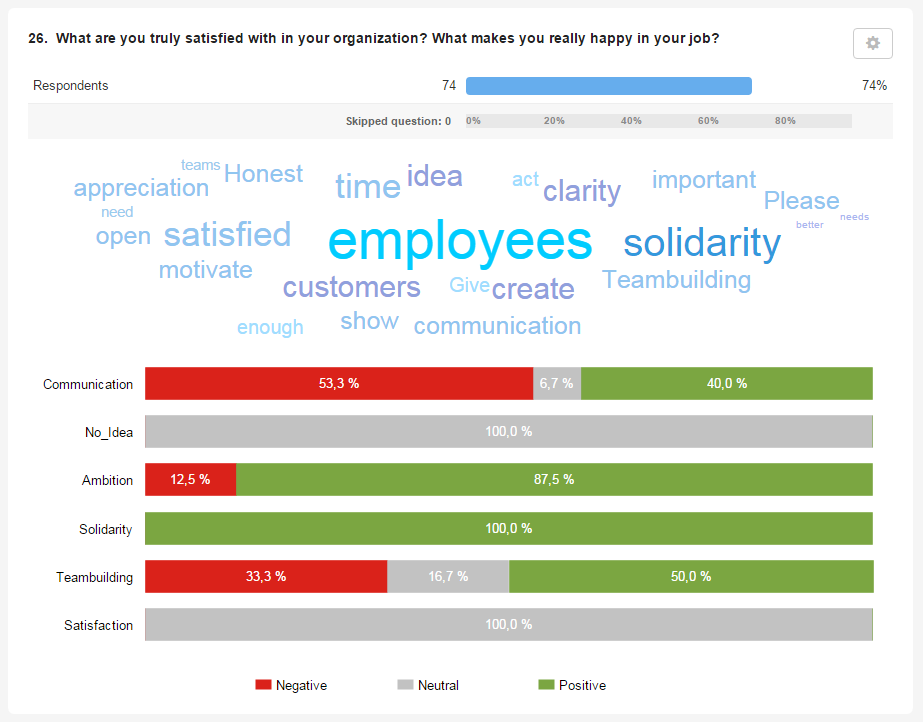
- Our survey tool generate beautiful and clear charts that show you how the categories stack up.
- Click on a category or sentiment to filter and see what impact it has on your satisfaction score.
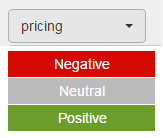
Sentiment analysis
Sentiments (opinions, emotions, attitudes, …) are a clear customer-experience indicator.
- Easily add a sentiment (positive, neutral, negative) to the tags you use for text analysis.
- Sentiments help you discover the key indicators for satisfaction AND dissatisfaction.
- For each keyword, a chart shows the percentages of positives, neutrals and negatives.
- You can filter the results on sentiments, for example by filtering to show only positive comments.
Get smart reporting
- Discover insights in the data that lead to action.
- Beautiful and clear charts show you how the categories stack up. Since it is integrated in our standard reports, you can, for example, click on a category or sentiment to filter and see what impact it has on your satisfaction score.
- The raw data downloads will contain all tags and sentiments, both in Excel and SPSS.
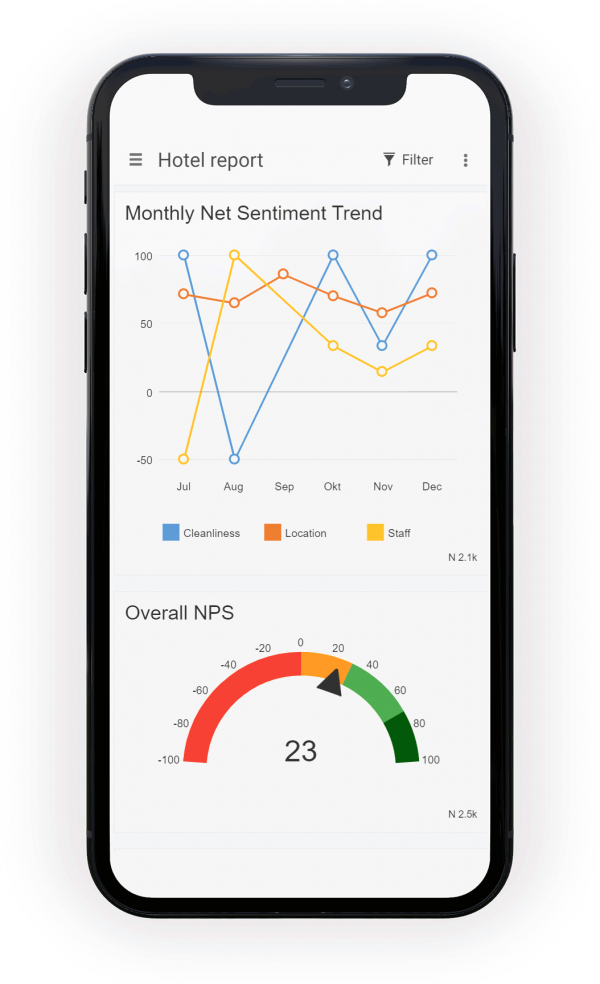
the Net Sentiment Score
Track sentiment from answers given to open-ended questions on a timeline to spot trends faster! Use Net Sentiment Score (NSS) which is simply the percent of positive sentiments minus the percent of negative sentiments. Now that we have our NSS, a single number, we can plot it on a timeline and easily spot trends. This consolidates a huge amount of information into an easy to read chart!
Automatic tagging
Use CheckMarket’s built-in automatic tagging to categorize open-ended survey questions as they come in. This is especially useful for long running surveys.
Auto-tagging is a process of applying tags to open answers based on keywords, in near real-time. We all know that open answers hold gems that lead to insight. Manual tagging can be slow, especially for large volumes. Auto-tagging can do the heavy lifting for you, so that you can spend time turning those insights into action!
Get inspired
See a reporting sample that shows you the tags and the sentiments.
Tips and tricks for survey text analysis
- Read every response. It might take some time, but it is worth it! You will really get to know the data. As you go through the open answers, you will start to see some trends.
- Create tags to categorize your answers with as you are reading through them. Every response should belong to at least one category. You can add multiple tags to one response.
- Use sentiments: determine whether a response is positive, negative or neutral. By doing this you will be able to identify clear trends, issues and suggestions from your respondents.
- Review the tags. After all the items are tagged, review the keywords and check to see if some keywords can be combined or be split into two.