Work@Home Pulse survey and reporting template
Check-in on employees working from home and see how they are doing and if they have all the resources they need. This package includes a best practice questionnaire and reporting.
Get started now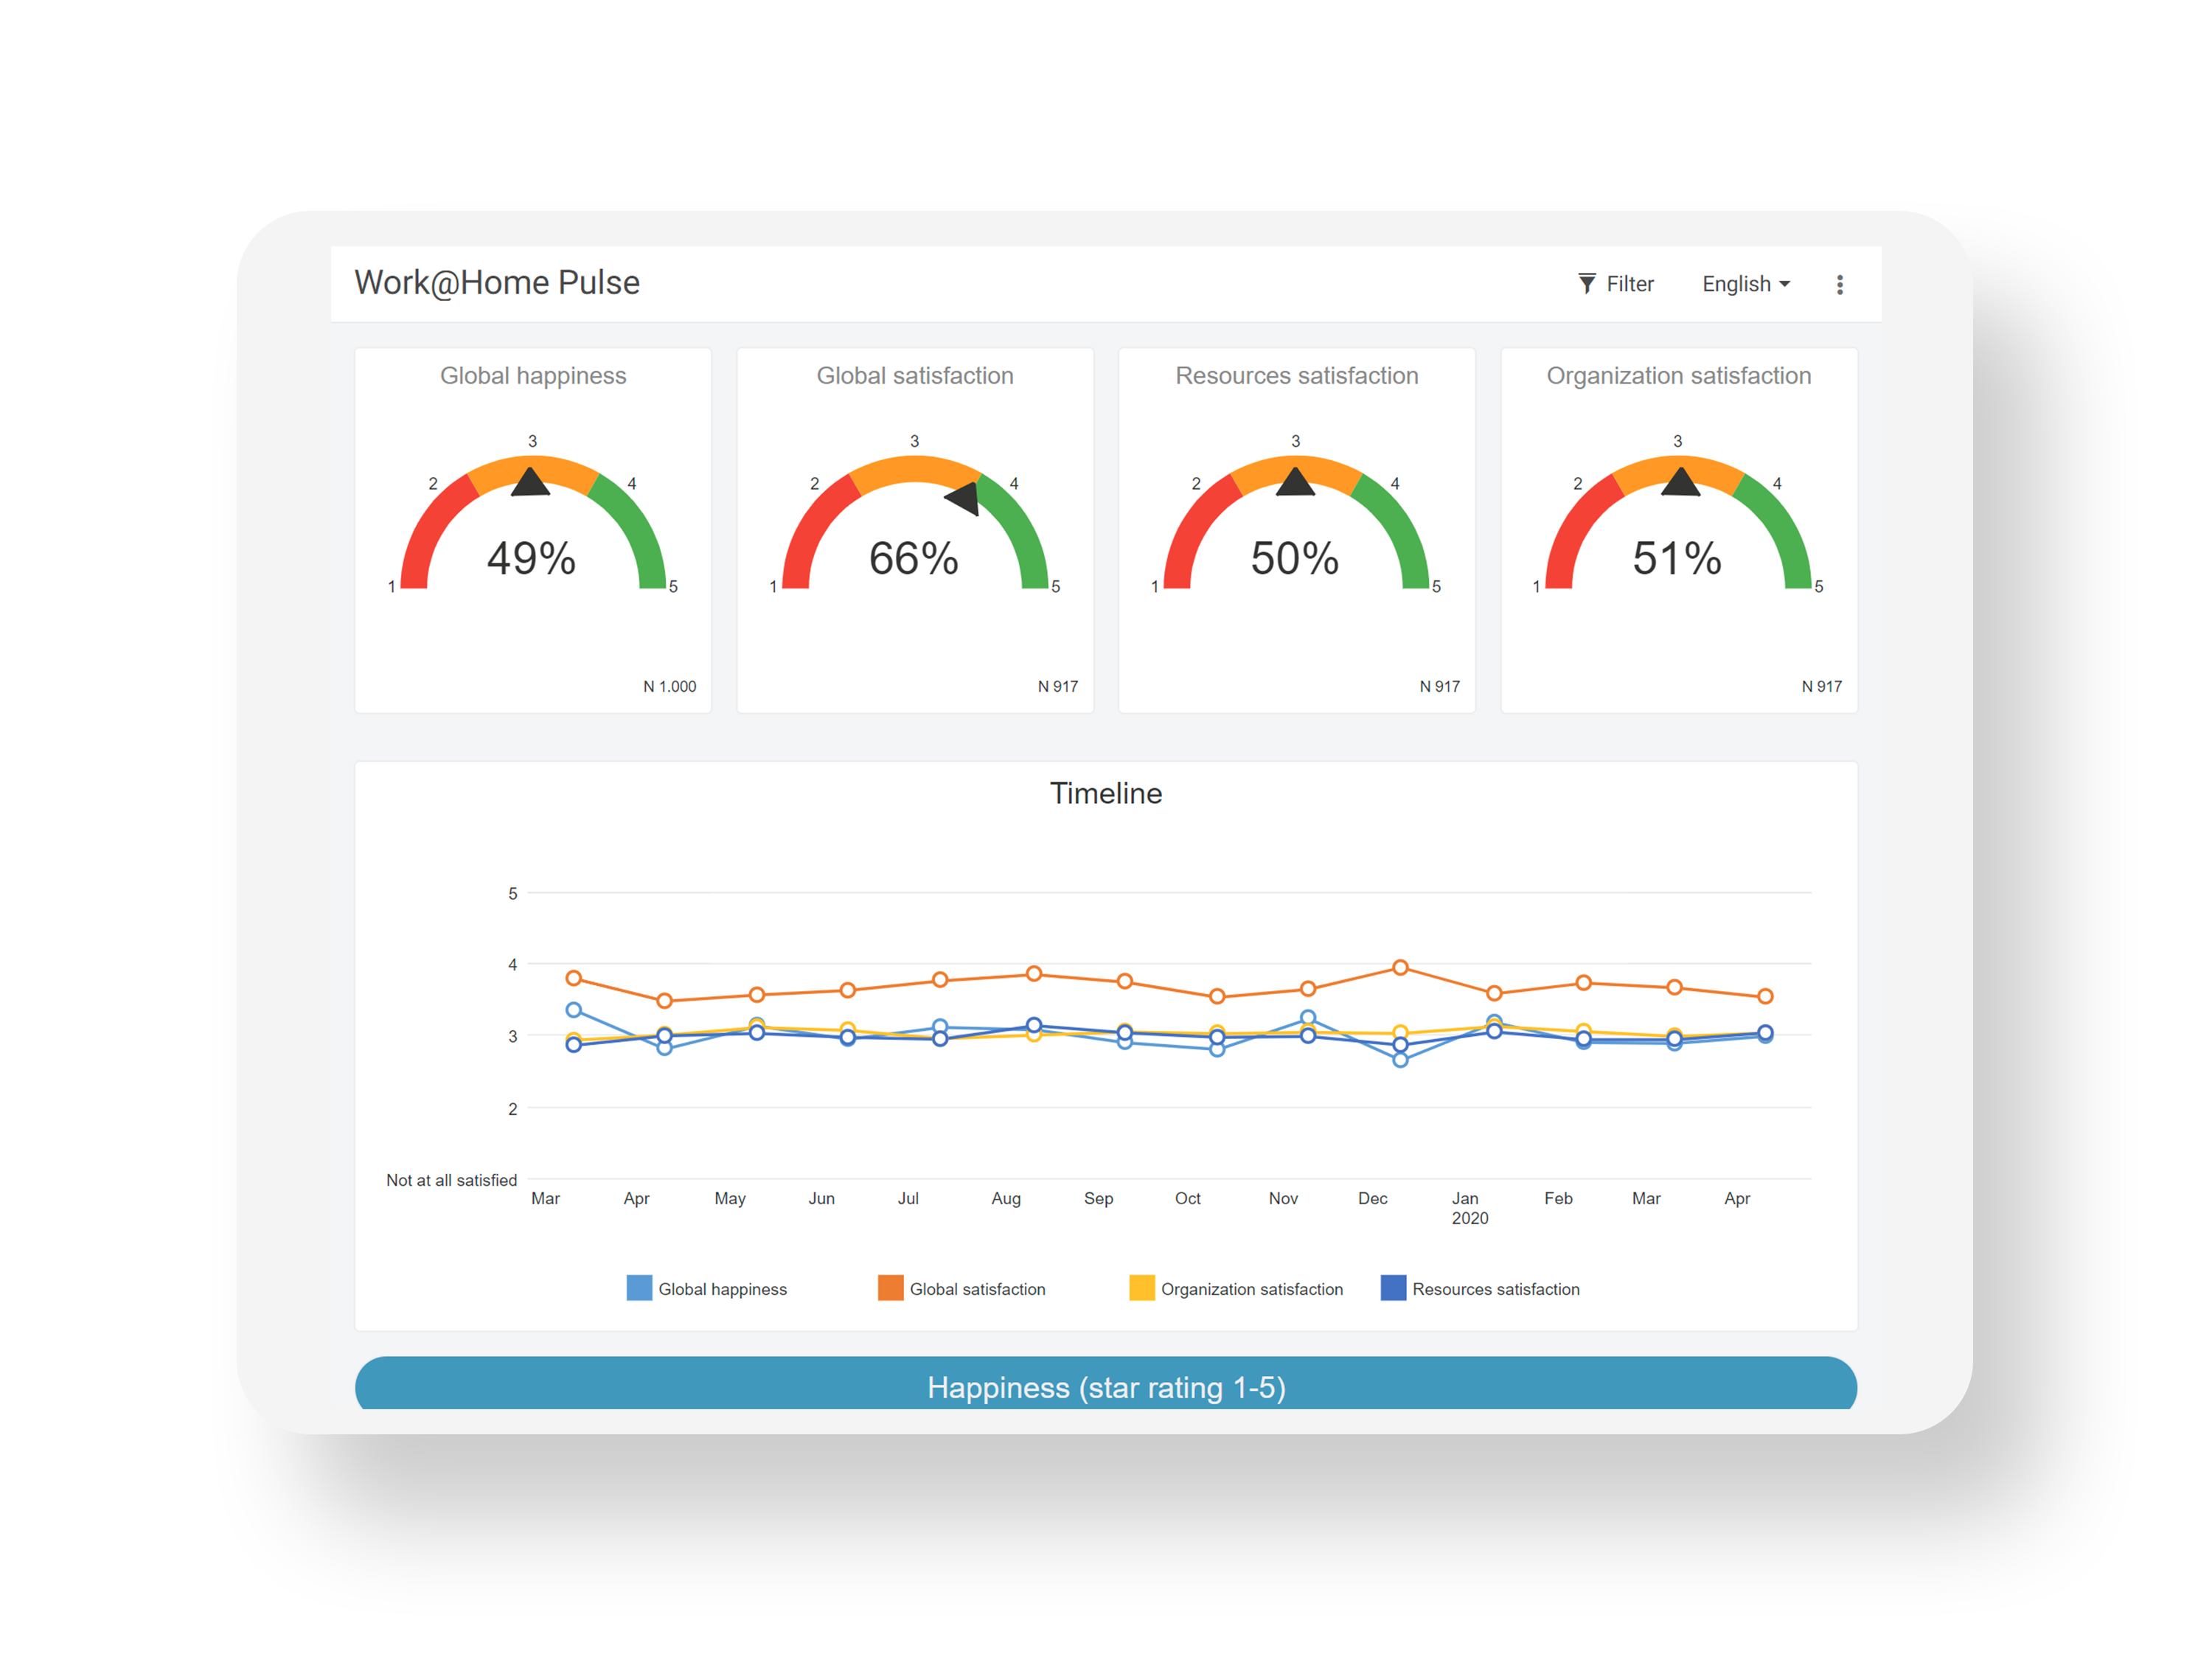
Real-time insights lead to action across the entire organisation
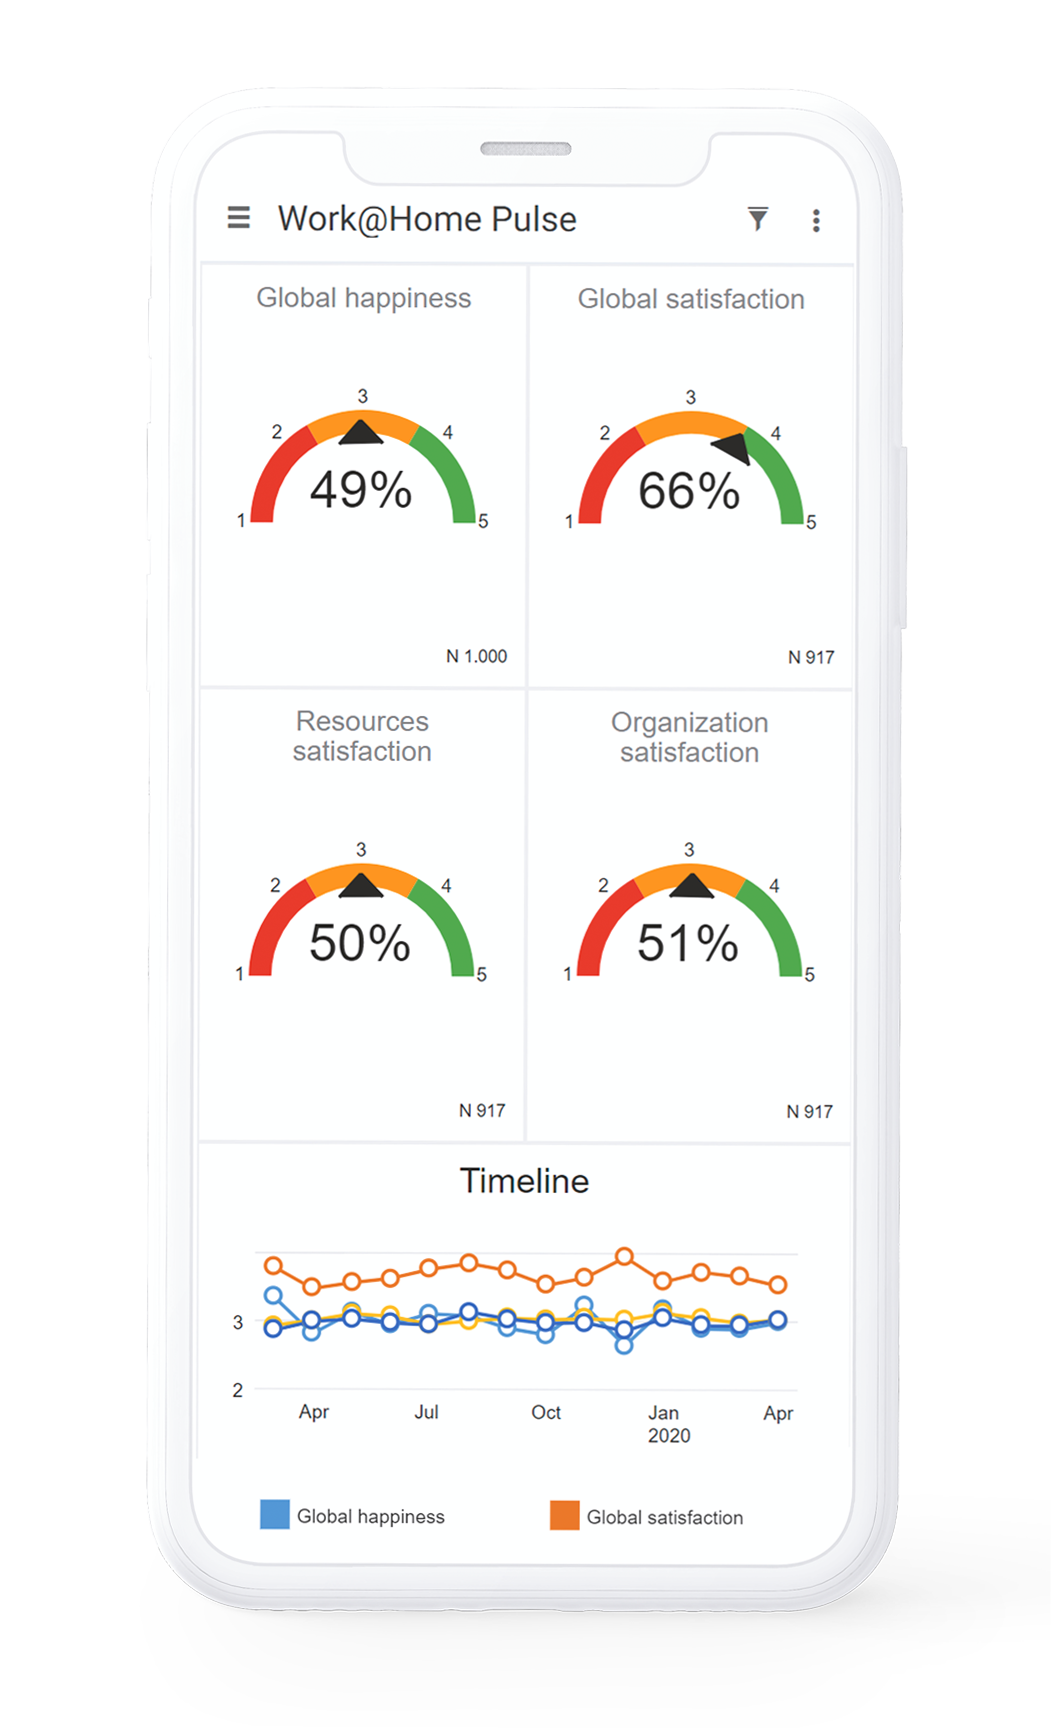
Start from our Work@Home Pulse report template to track results by day and by department. Track happiness, satisfaction, resource needs from one dashboard.

Reports & dashboards
Build multi-tiered reports & dashboards to track the numbers day by day and on timelines.

Notifications
Send a notification to a supervisor when an employee indicates that they are very unhappy or do not have the resources they need.

Filters
Drill down per department, location and other operational / hierarchical data.

Our experts are here for you
Do it entirely yourself with our template or call in the cavalry. Our experienced research experts can help you to set up the forms, notifications and reports.
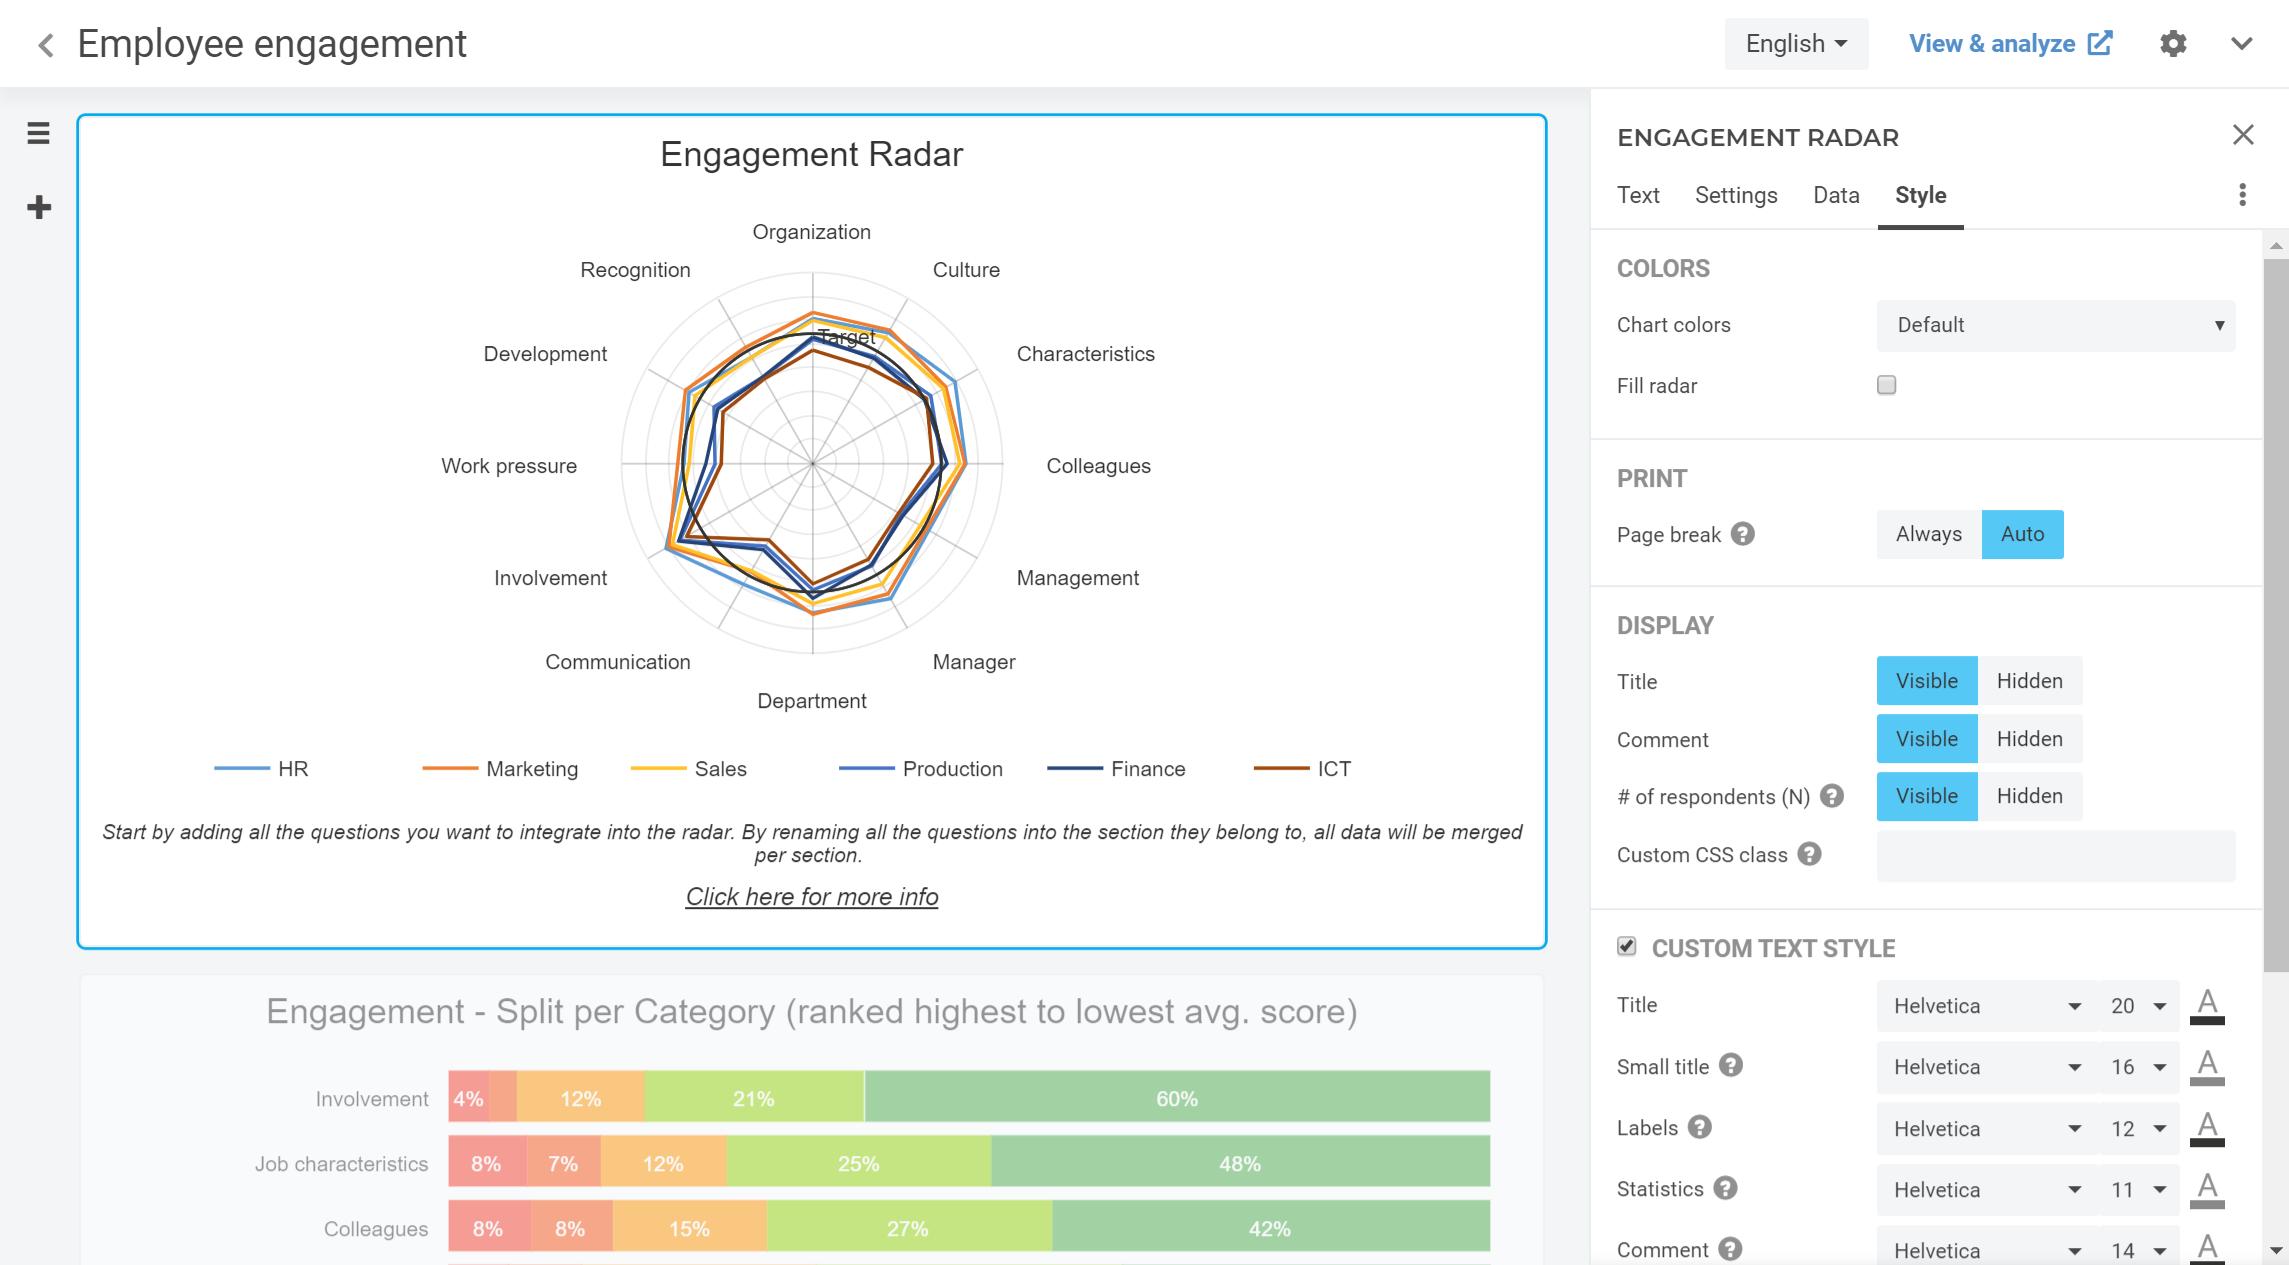
Multi-tier reporting
Empower managers in your organisation to monitor employee happiness and resource needs with real-time insights that show them exactly where to focus their efforts to increase employee performance. Get the information deep into your organization in order to improve processes.
- Filter by hierarchy
- Benchmarks
- Text analysis
- Key Driver analysis
- more...
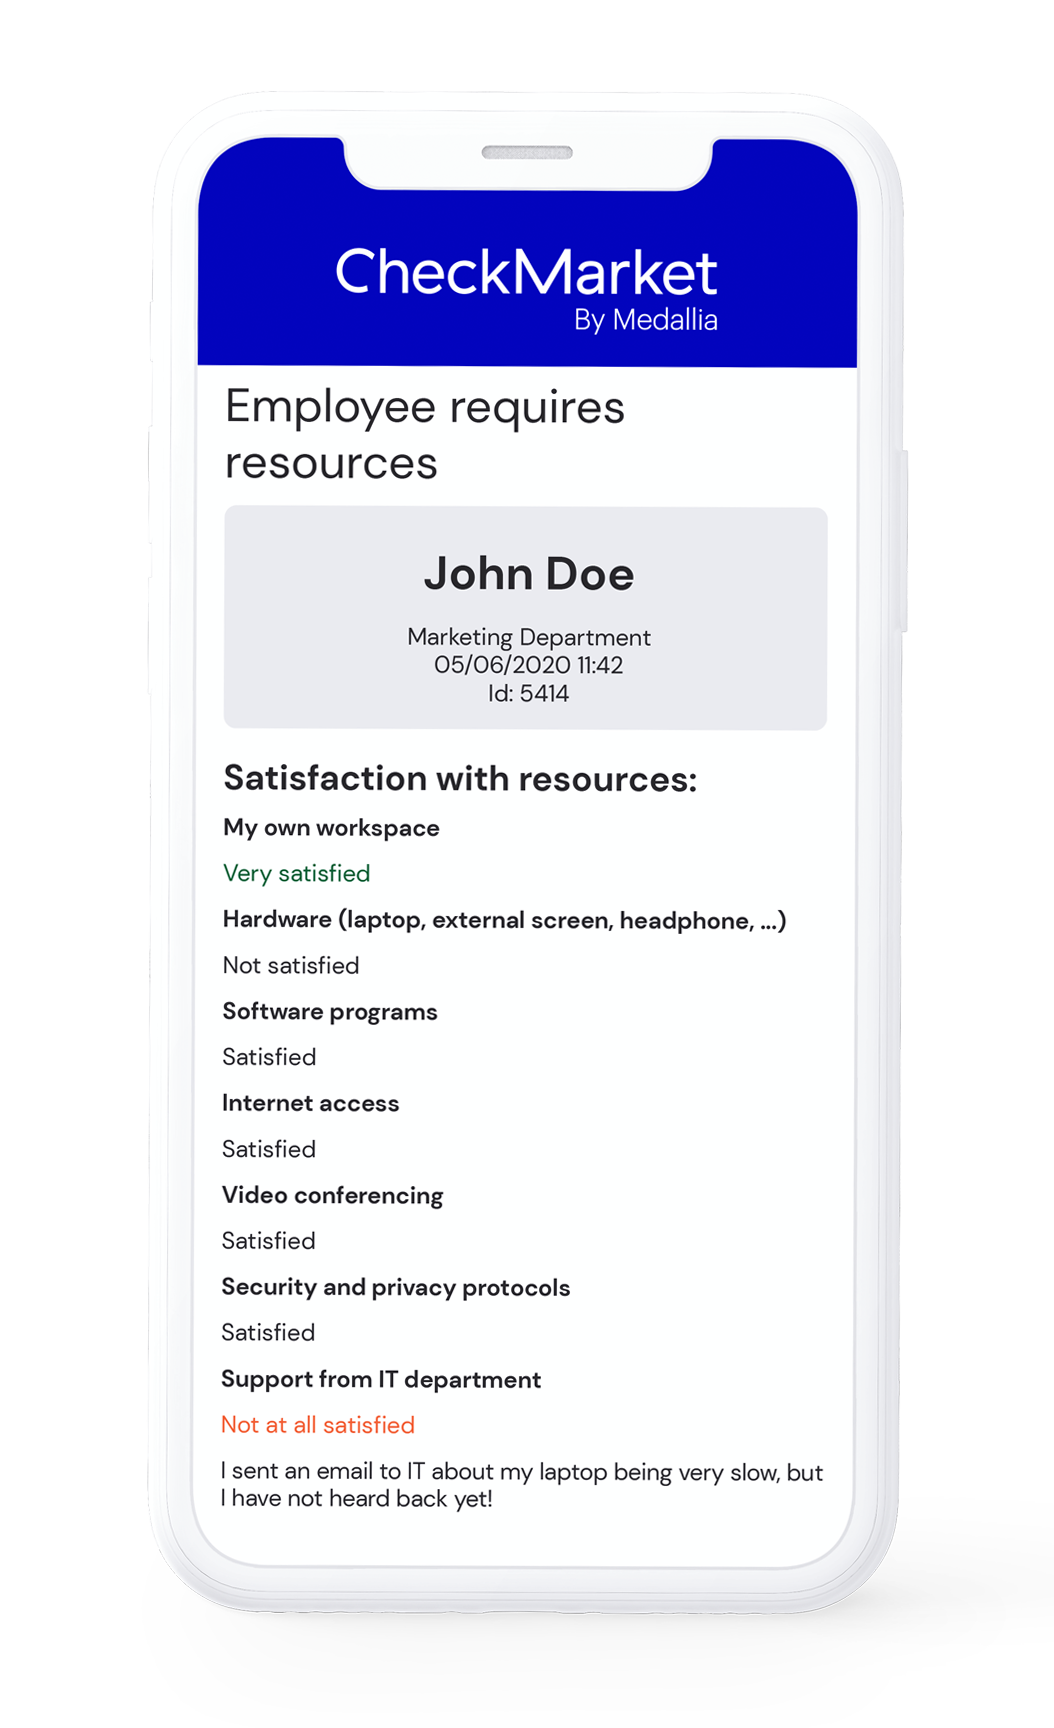
Get automated notifications
Automated notifications give you the opportunity to quickly act when an employee needs resources or is unhappy. Set conditions based on how respondents answer the questionnaire to trigger notifications.
Examples are: sending an email, a text message, or posting to slack when an employee indicates that they do not have the resources they require.
Notifications can also trigger internal follow-up forms, for better management and ticketing. This will improve your workflow drastically.
- Text message (SMS)
- Slack
- Zendesk
- CRM
- HTTP request
- Zapier
Experts to assist you
You can manage everything yourself or build a remote worker pulse program with our help. Our solution architects can set up a workflow to make sure you get the information you need to the correct people. We’ll tailor the form and reporting to your unique needs.
- Help setting up the questionnaire
- Help setting up notifications
- Help setting up the reporting


Automation & integrations
CheckMarket’s API
Automate your research and save time and money using our survey API. It’s not just about sending your operational data to CheckMarket. It is about the full circle. Getting data and insights back into your systems is crucial, so you can get feedback a lot faster and measure continuously. (Read more)
Integrations
CheckMarket loves simplifying! Our software integrates with your favorite tools, so you can automate your daily tasks. Our survey integrations allow you to share data between our survey platform and Salesforce, Zendesk, Slack, Zapier, Microsoft and social media. (Read more)
Webhooks
Webhooks allow you to build or set up integrations which subscribe to certain survey events. Webhooks can be used to synchronize internal data, invalidate caches or even adapt your application flow. You’re only limited by your imagination. (Read more)
Report per department
After you are done building reports and dashboards, share it with others. Create different share links, each with different filters, depending on what you want viewers to see all based on your own operational data, hierarchy and organization.
That means if you want to have a report for each location or each region of your organization, you do not need to create 10 different reports. Instead, you build one report and then create 10 shares with each share filtered to only show the data for a region or location.
When you later decide to make a small change to the report, you only have to do it once and everyone will see the change.
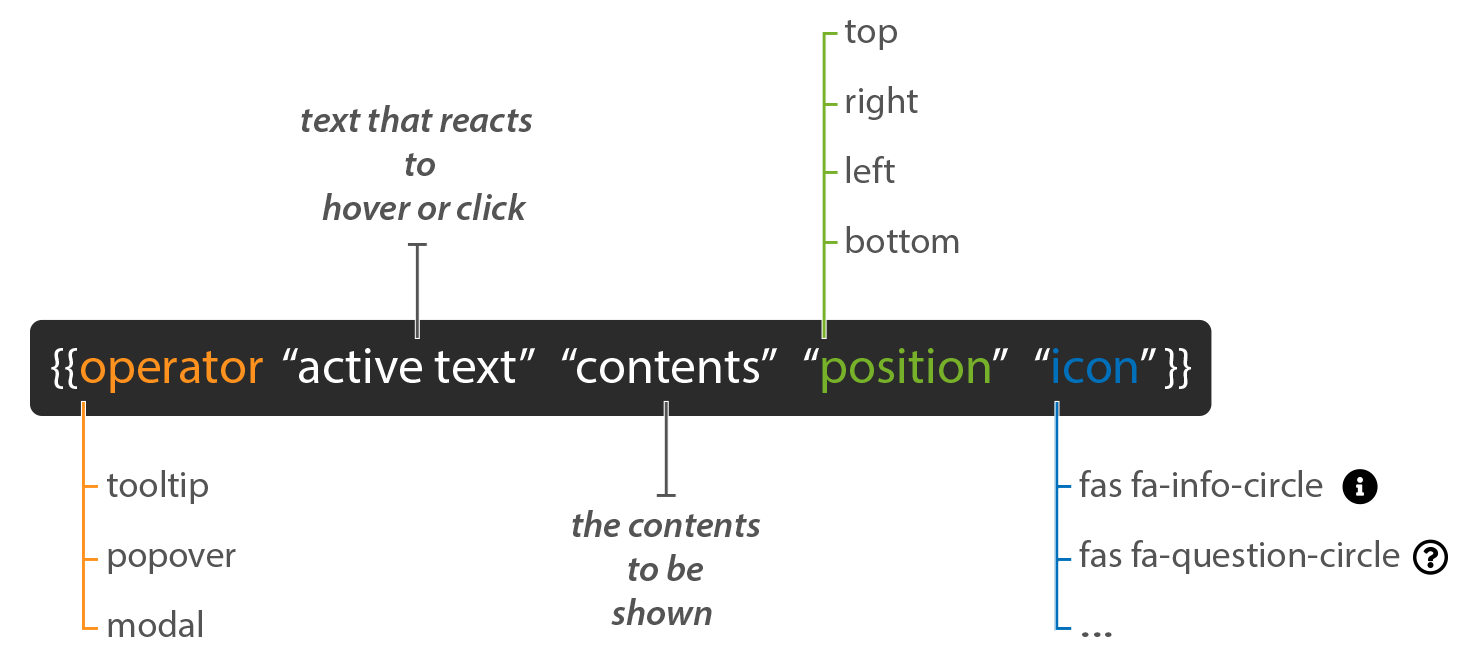
Dynamic text
CheckMarket offers a powerful scripting language to enhance your reports.
At its most advanced, our scripting language gives you tremendous freedom to use complex logic to make calculations, show or hide certain blocks of texts or images and much more. For instance if the fail rates for a location are higher than the benchmark of the whole organization, show them a message with action points, automatically.
Excellent real-time dashboard and notification possibilities. We were up and running quickly!