Customer Satisfaction
Monitor customer satisfaction and customer experience (CX) across the customer journey. Close the loop with shareable reports, dashboards, alerts and follow-up tools.
Try it yourself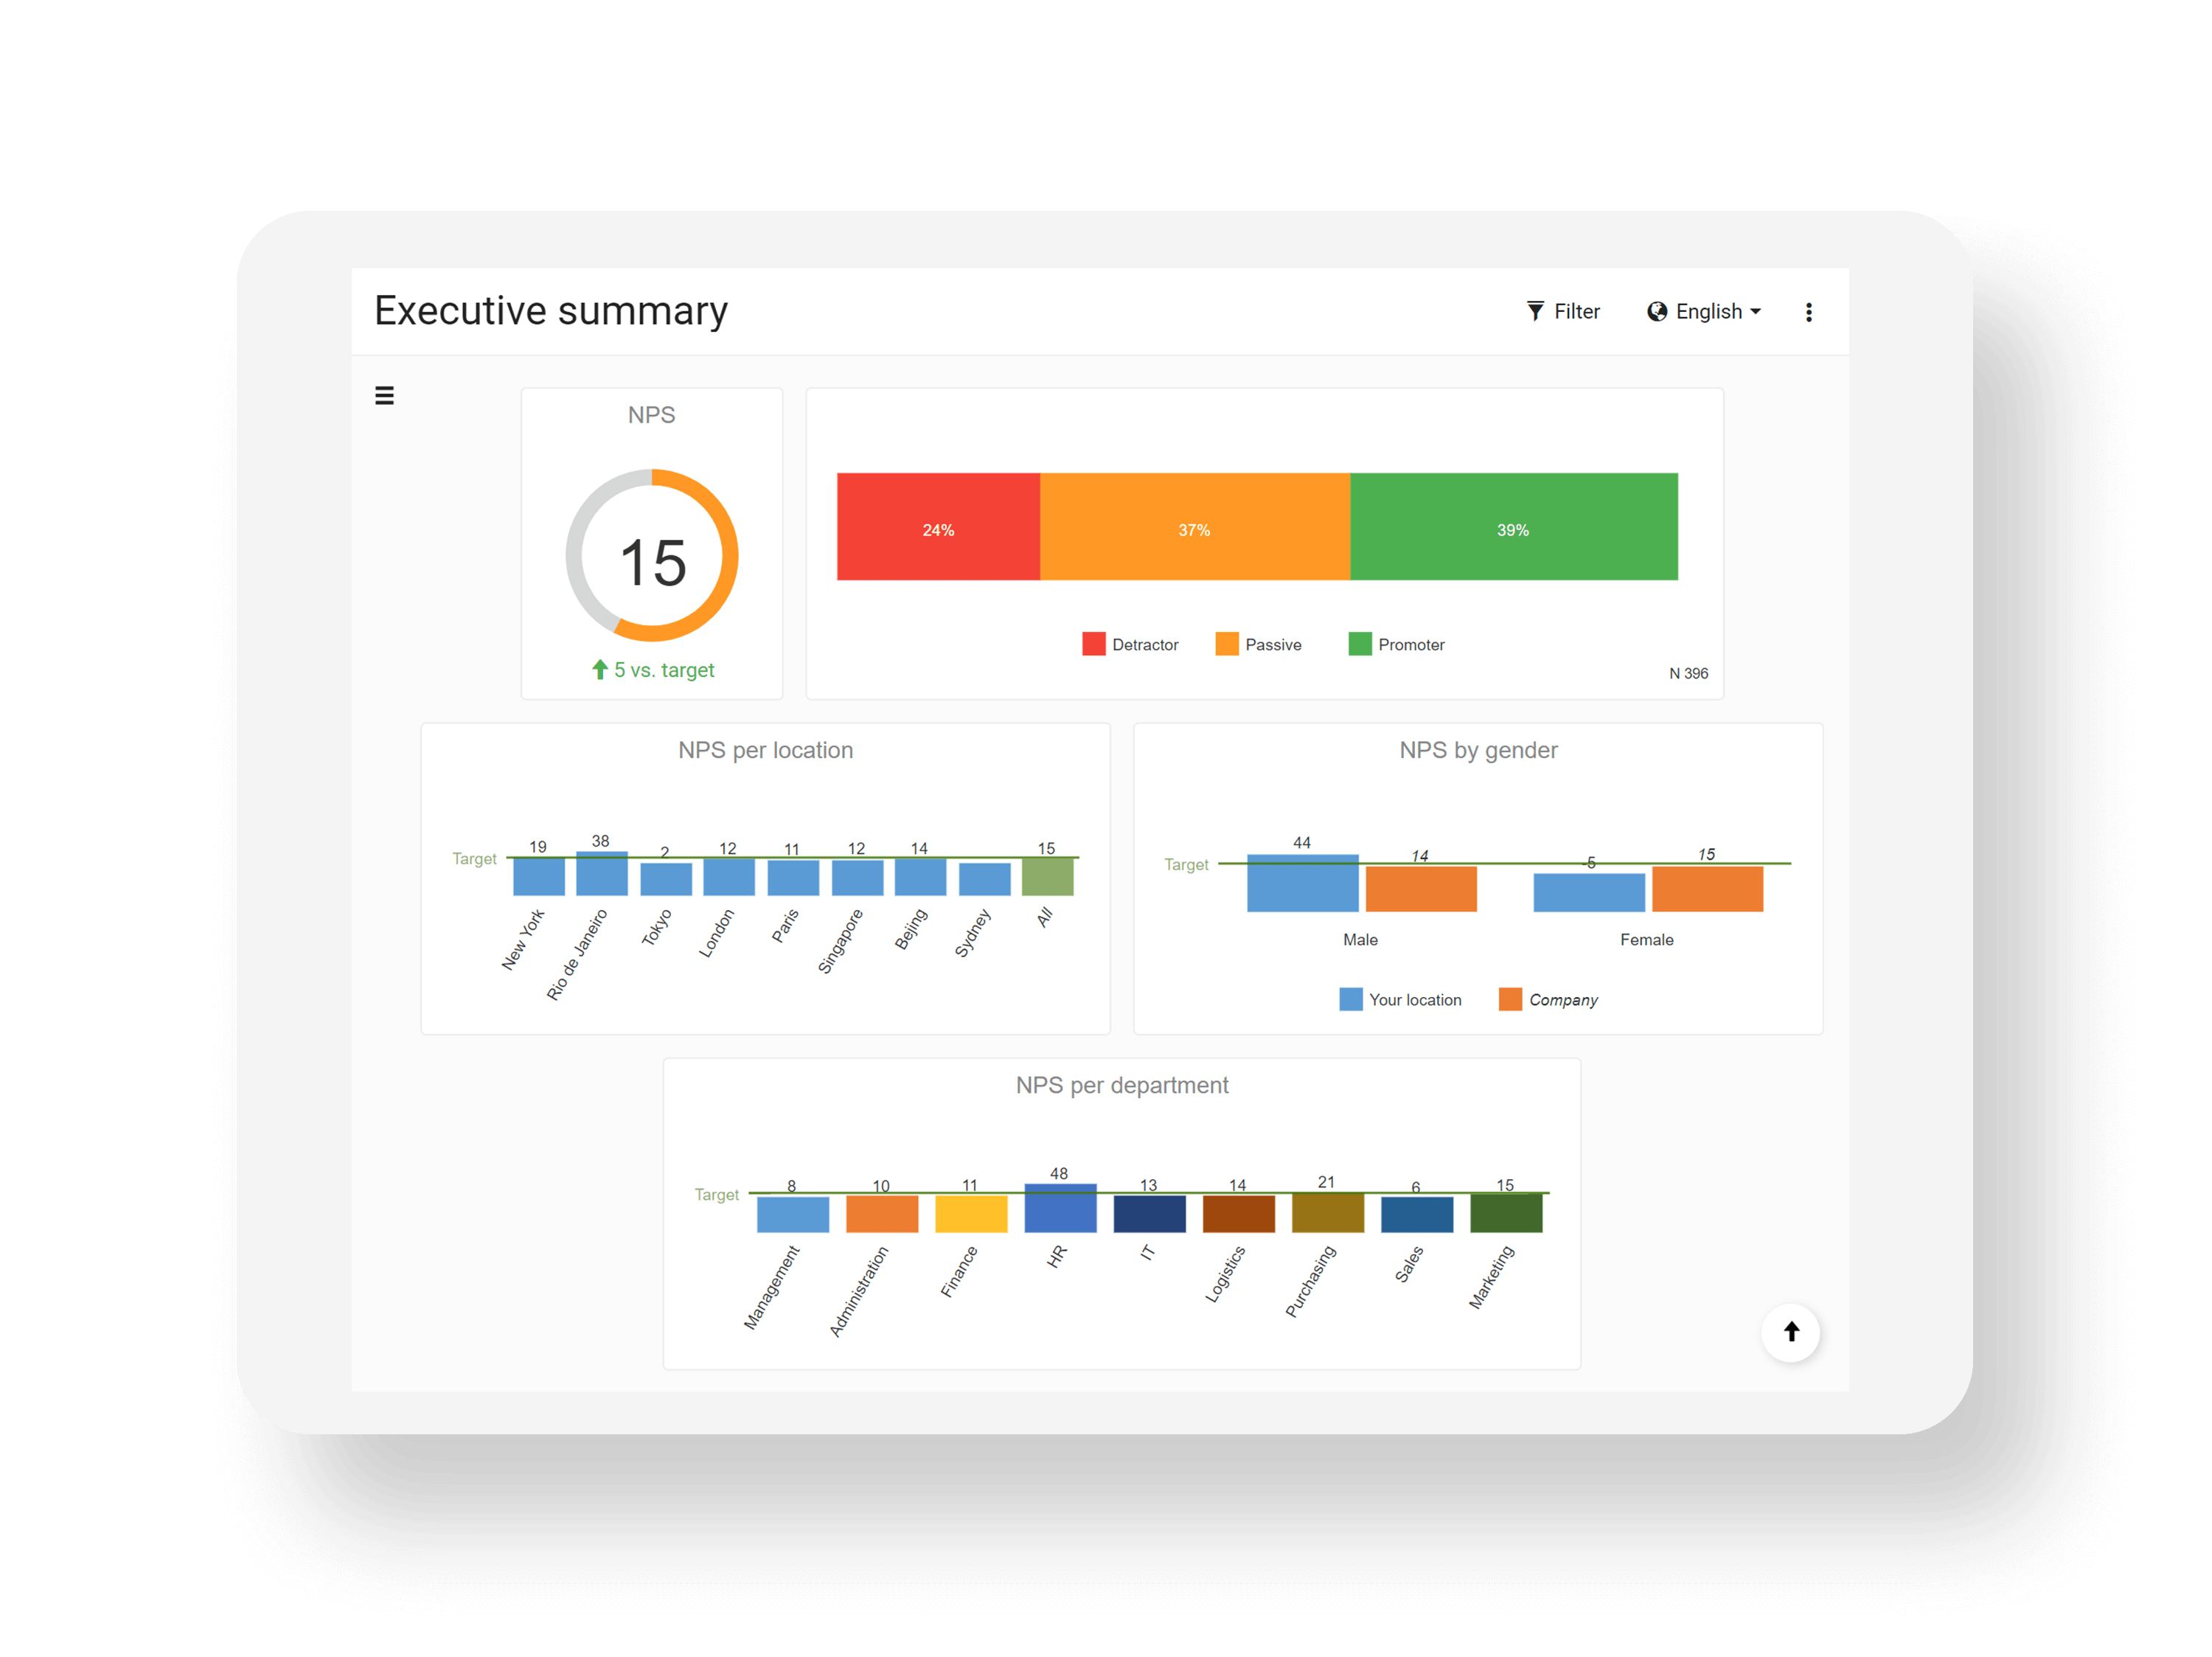
Real-time insights lead to action across the entire organisation
Merge your survey results with your operational data and setup alerts to get that information to the right people in your organization with issue follow-up.
Reports & dashboards
Build multi-tiered reports & dashboards integrating your own operational data and then share them.
Text & sentiment analysis
Built-in text & sentiment analysis and automatic text-mining lets you get the most out of your open answers.
Get everyone involved
Identify important response patterns and send automatic, real-time push notifications that help your team act.
Our experts are here for you
Do it entirely yourself with our templates or call in the cavalry. Our experienced research experts can help you to acquire action-oriented insights.
Awesome reporting
Collecting data is just the first step. The real value lies in the efficiency of reporting. We provide you with real-time reporting so you can spot trends earlier, and get the information deep into your organization in order to improve processes.
- Real-time reports and dashboards
- Benchmarks
- Text analysis & auto-tagging
- Key Driver analysis

Experts to assist you
Build a world-class CX program with our help. Our solution architects can set up a workflow, using best-practice and make sure you succeed. We’ll tailor our services to your unique needs.
- Onboarding
- best practice
- follow-up workflows
- Actionable
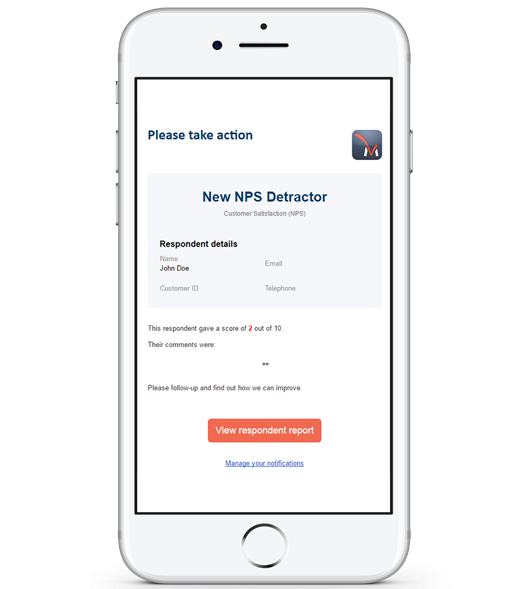
Get automated notifications
Automated notifications give you the opportunity to quickly interact with your respondents. Set conditions based on how respondents answer surveys and when these conditions are met, they trigger the notifications.
Examples are: sending an email, a text message or Tweet; generating a lead in Salesforce; creating a Zendesk ticket and sending a message in Slack.
Notifications can also trigger internal follow-up surveys, for issue management and ticketing. This will improve your workflow drastically.
If used correctly, automated notifications can win back at-risk customers before it is too late. They allow you to communicate with dissatisfied customers to learn and repair damaged relationships through coordinated follow-up.

Automation & integrations
CheckMarket’s API
Automate your research and save time and money using our survey API. It’s not just about sending your operational data to CheckMarket. It is about the full circle. Getting data and insights back into your systems is crucial, so you can get feedback a lot faster and measure continuously. (Read more)
Integrations
CheckMarket loves simplifying! Our software integrates with your favorite tools, so you can automate your daily tasks. Our survey integrations allow you to share data between our survey platform and Salesforce, Zendesk, Slack, Zapier, Microsoft and social media. (Read more)
Webhooks
Webhooks allow you to build or set up integrations which subscribe to certain survey events. Webhooks can be used to synchronize internal data, invalidate caches or even adapt your application flow. You’re only limited by your imagination. (Read more)
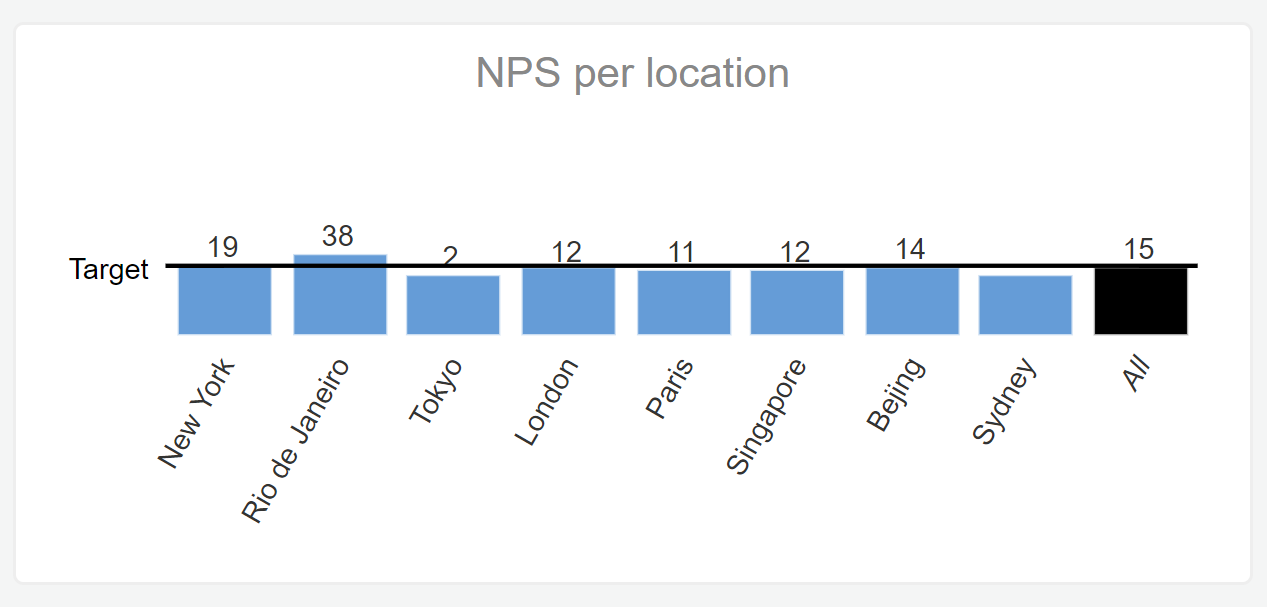
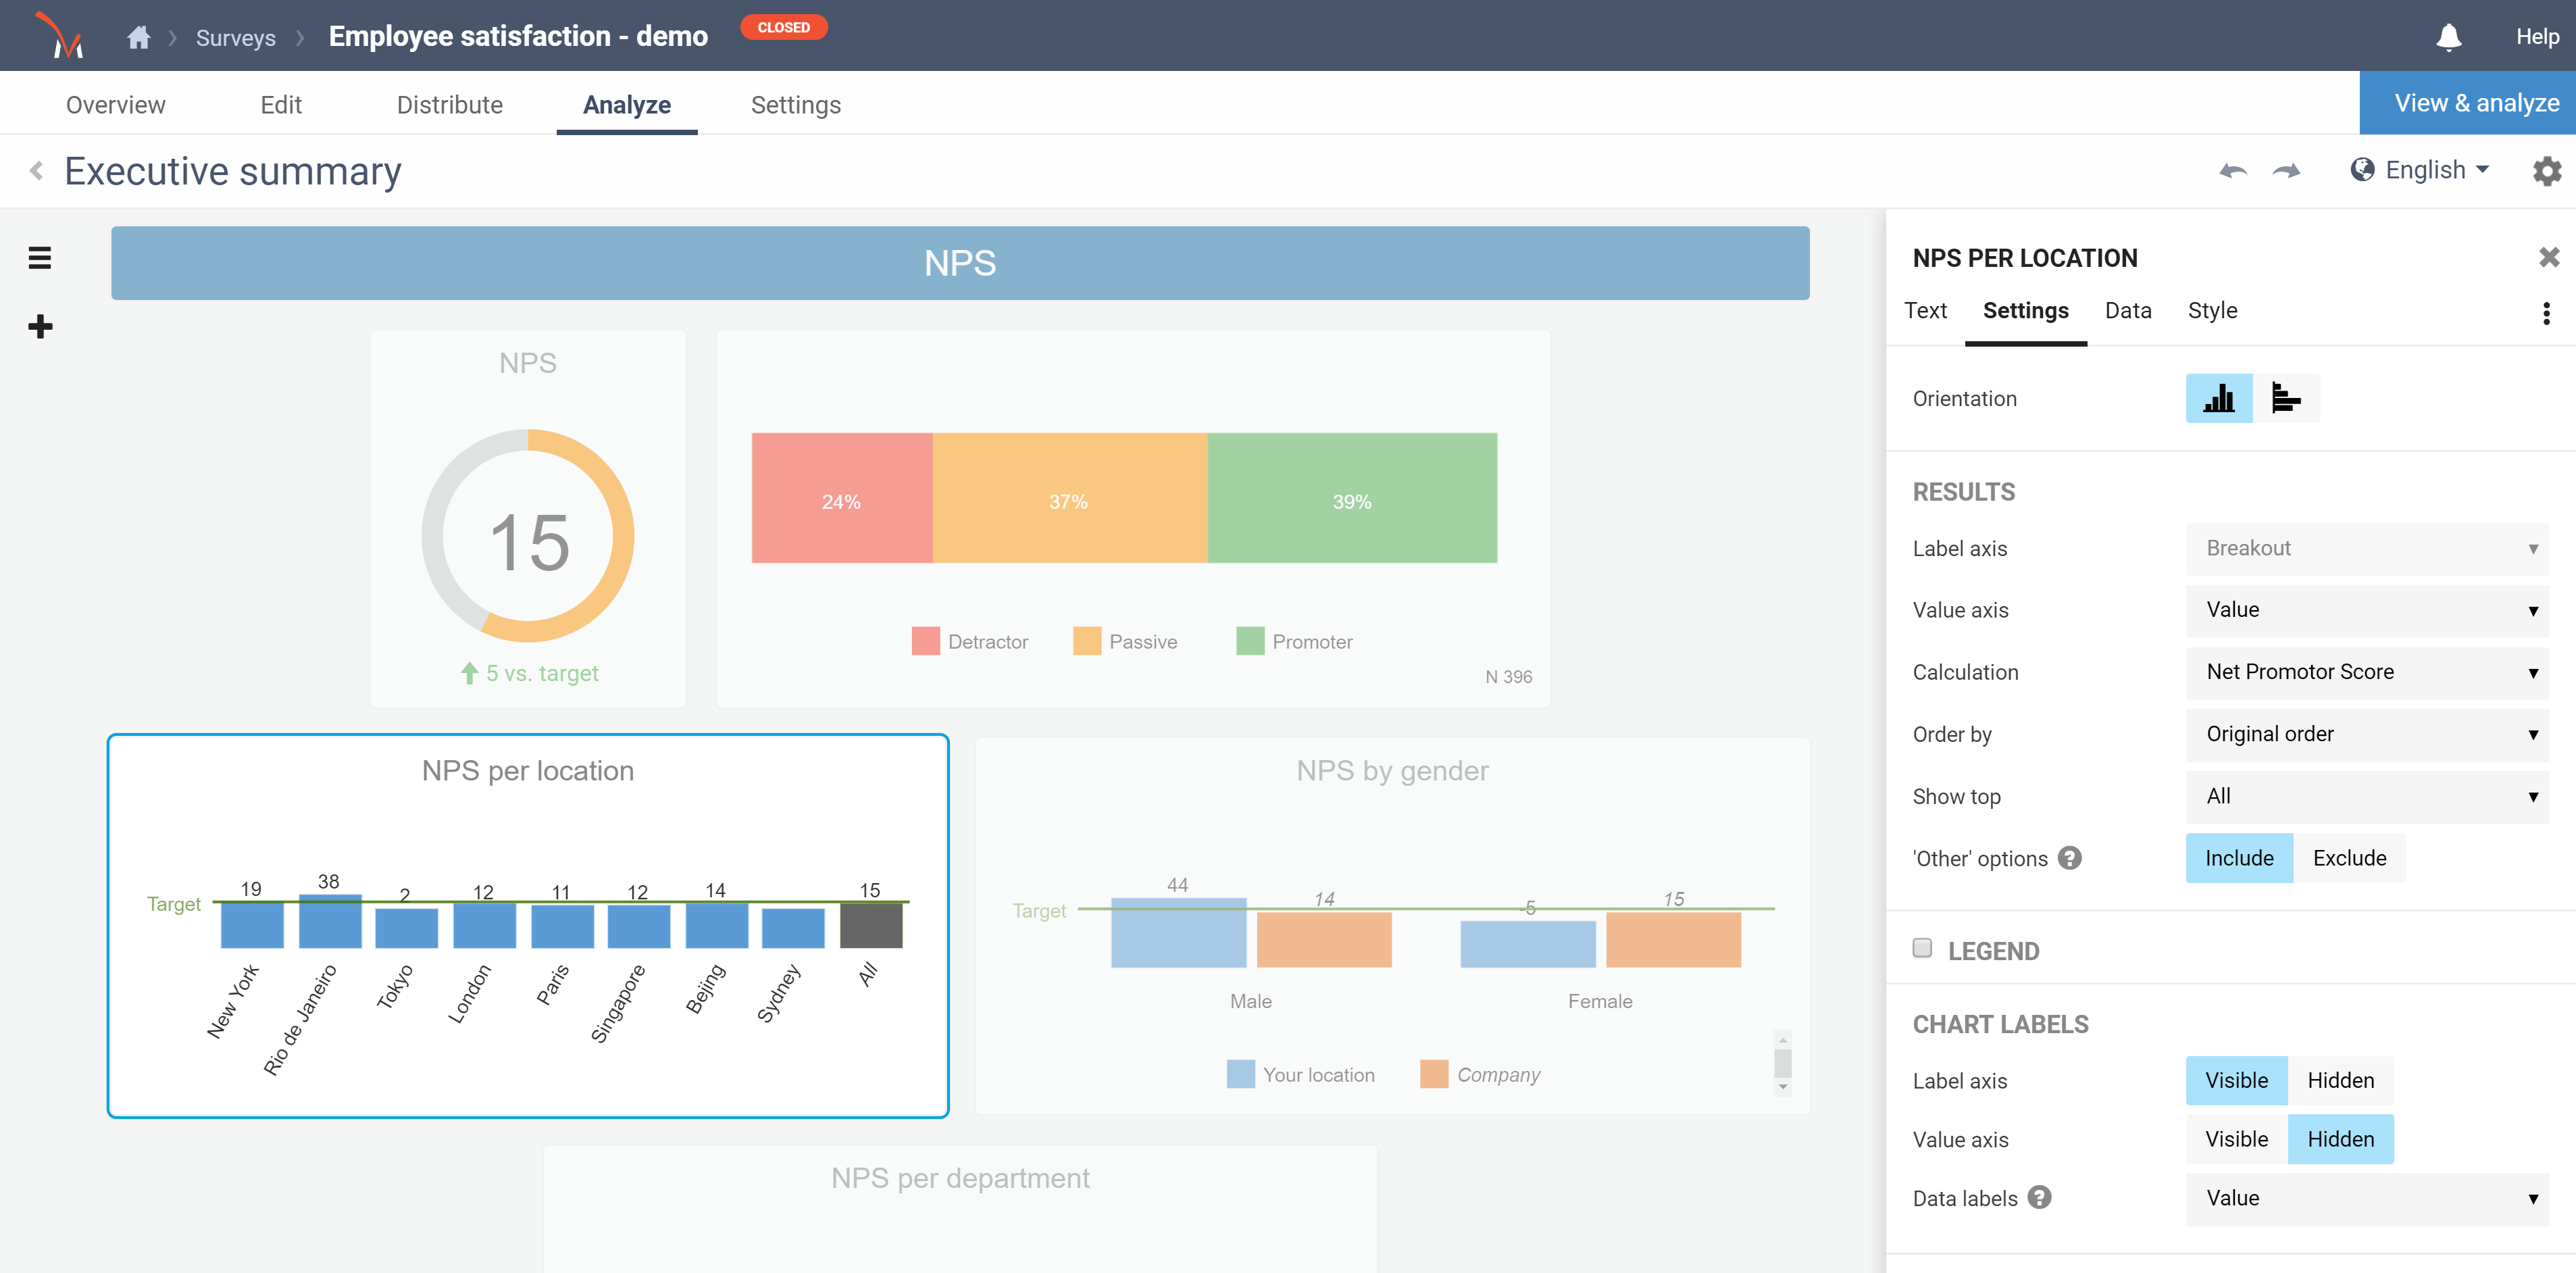
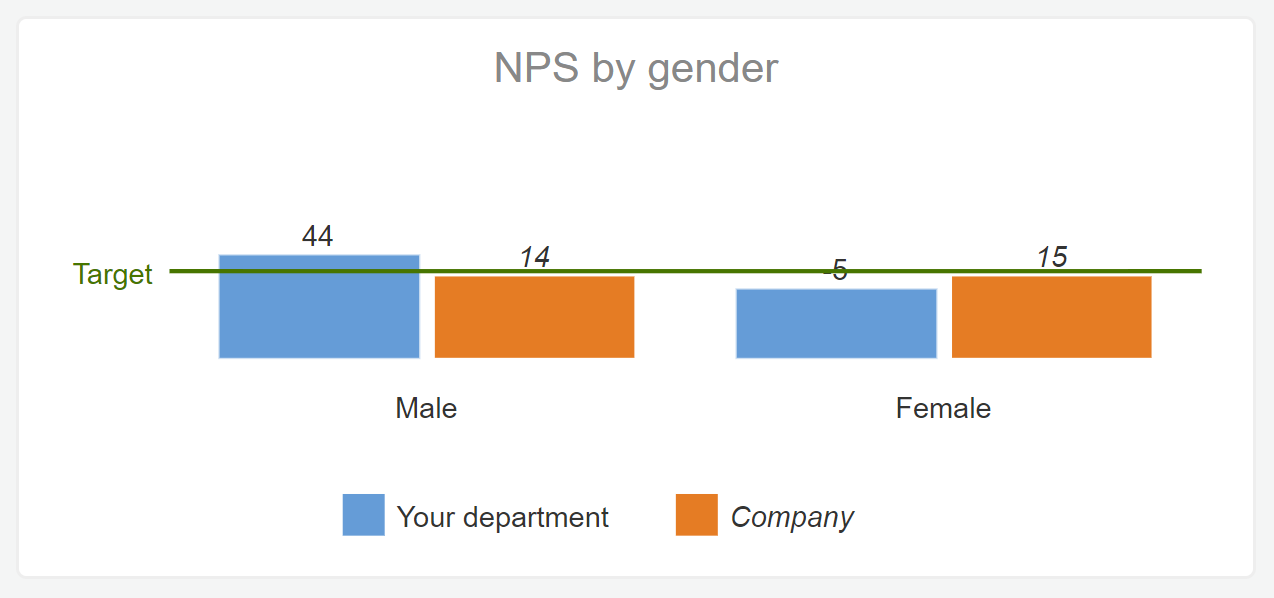
Benchmarks
You can add a benchmark to a chart to show a global score. For instance, show the combined NPS score for all stores next to the breakout of the individual store scores, or show the NPS score from last month vs this month.
- Dynamic
- Fixed
- Own filters
- Column
- Line
- Arrow
Break-outs
This is one of the most awesome features of the report builder. It lets you take a score, like e.g. NPS, and ‘break it out‘ based on another question or custom field. For example, compare the NPS scores for different store locations or customer types. When you add a new store location to the survey, it will automatically be added to the breakout in your report!
Merging
You can combine and merge answer choices, presenting them as one in a report element. To do so, simply give the answer options you want to group together, the exact same label. This will combine the results of those answer options and show them together under one unified label. This does not alter the underlying data or survey question.
Sharing
After you are done building an insightful report, share it with others. Create different share links, each with different filters, depending on what you want viewers to see all based on your own operational data, hierarchy and organization.
That means if you want to have a report for each department or each region of your organization, you do not need to create 10 different reports. Instead, you build one report and then create 10 shares with each share filtered to only show the data for a region or department.
When you later decide to make a small change to the report, you only have to do it once and everyone will see the change.
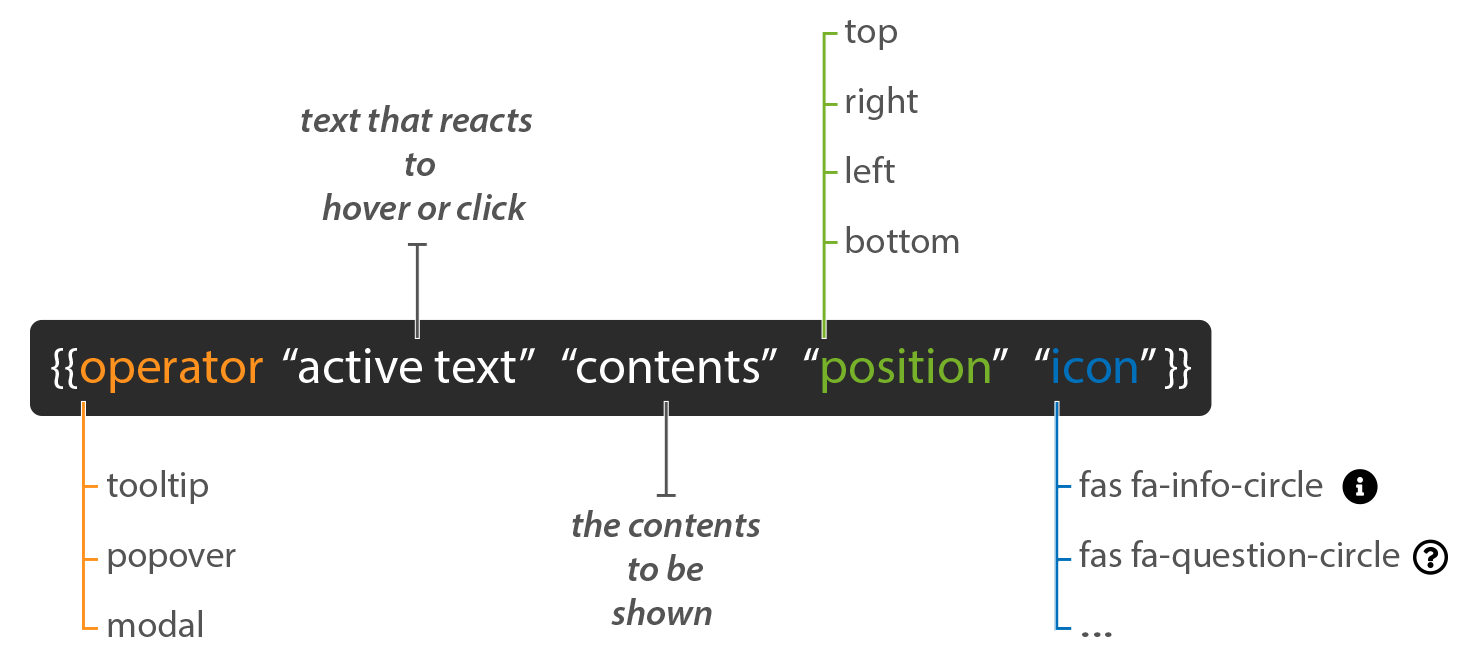
Dynamic text
CheckMarket offers a powerful scripting language to enhance your reports.
At its most advanced, our scripting language gives you tremendous freedom to use complex logic to make calculations, show or hide certain blocks of texts or images and much more. For instance if the NPS from a region is less than the benchmark of the whole group, show them a message with action points, automatically.
Text analysis
Use tags to quickly group responses into categories. Apply sentiment (negative, neutral or positive) to identify the underlying feeling.
Beautiful and clear charts show you how the categories stack up. Since open text analysis integrated in our standard reports, you can, for example, click on a category or sentiment to filter and see what impact it has on your satisfaction score. Tagging even works across multiple languages!
Activate automatic tagging of survey responses as they come in! This is not a separate product, it is built into CheckMarket and included in our different plans at no extra cost!

Excellent realtime dashboard and great tagging possibilities. Tagging the answers in the dashboard is really easy to use and generates insights quickly!