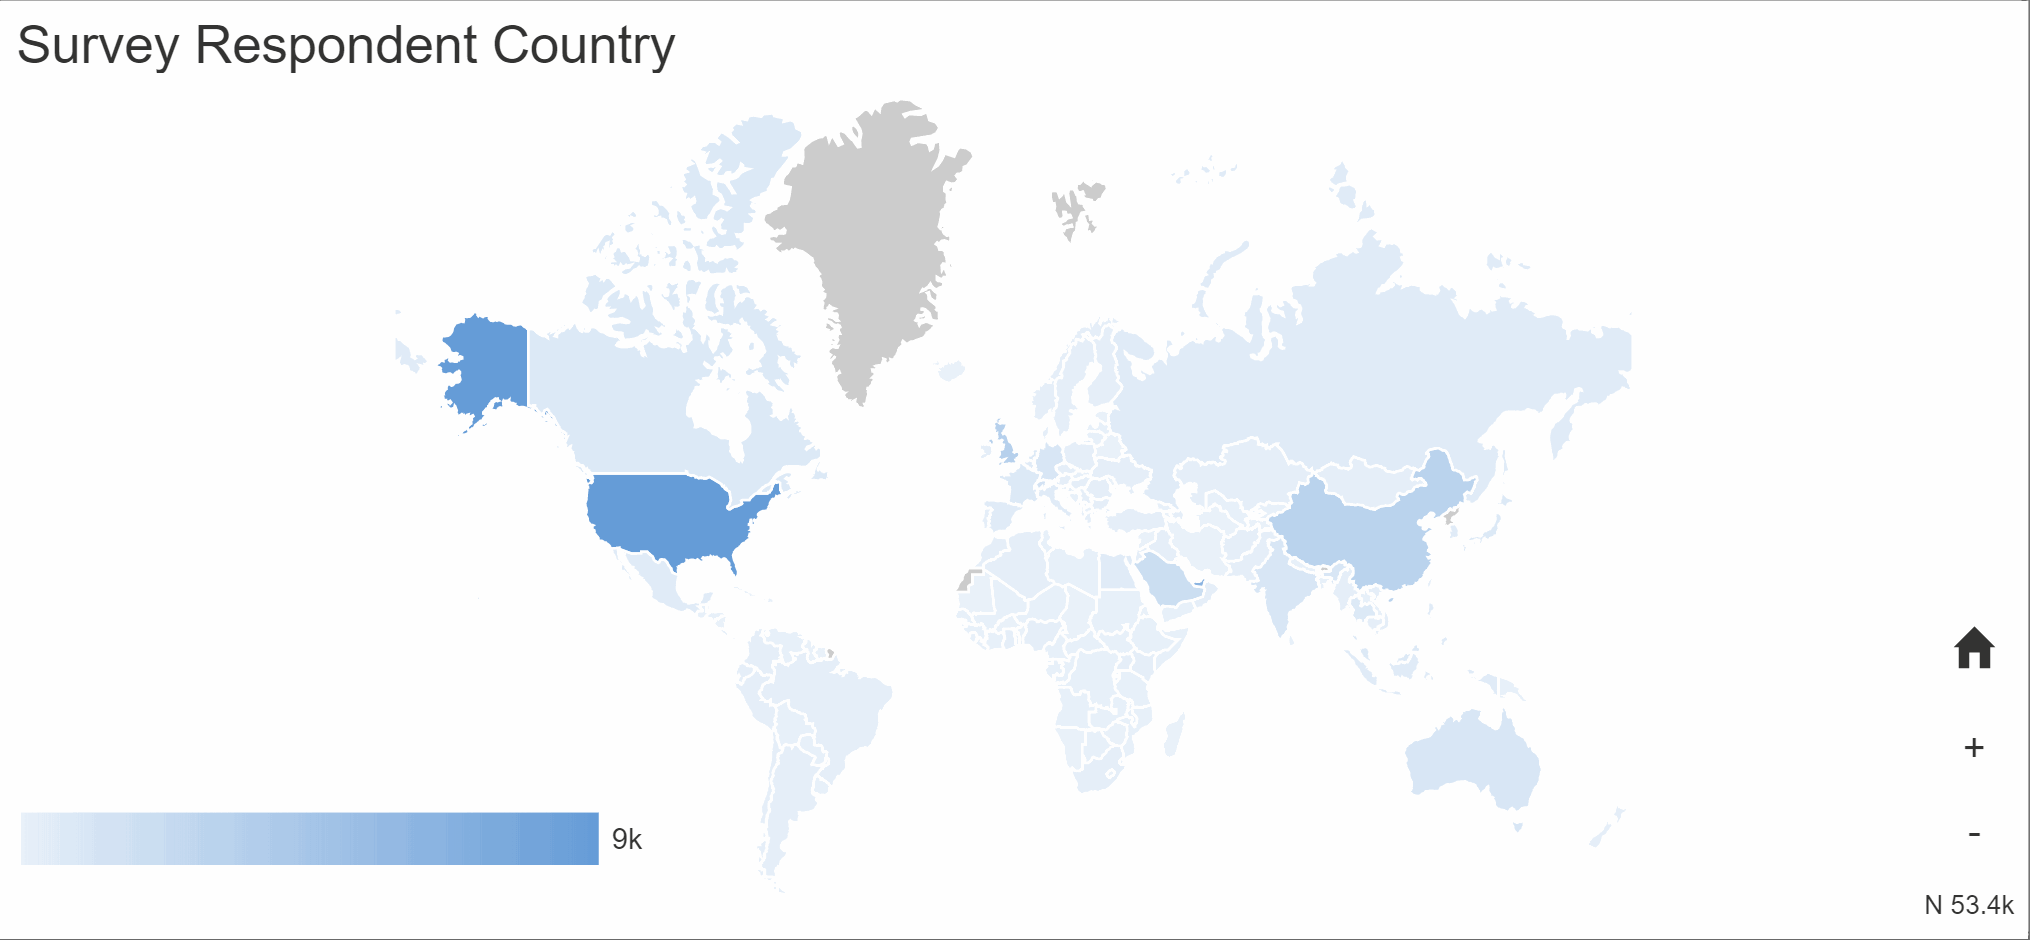
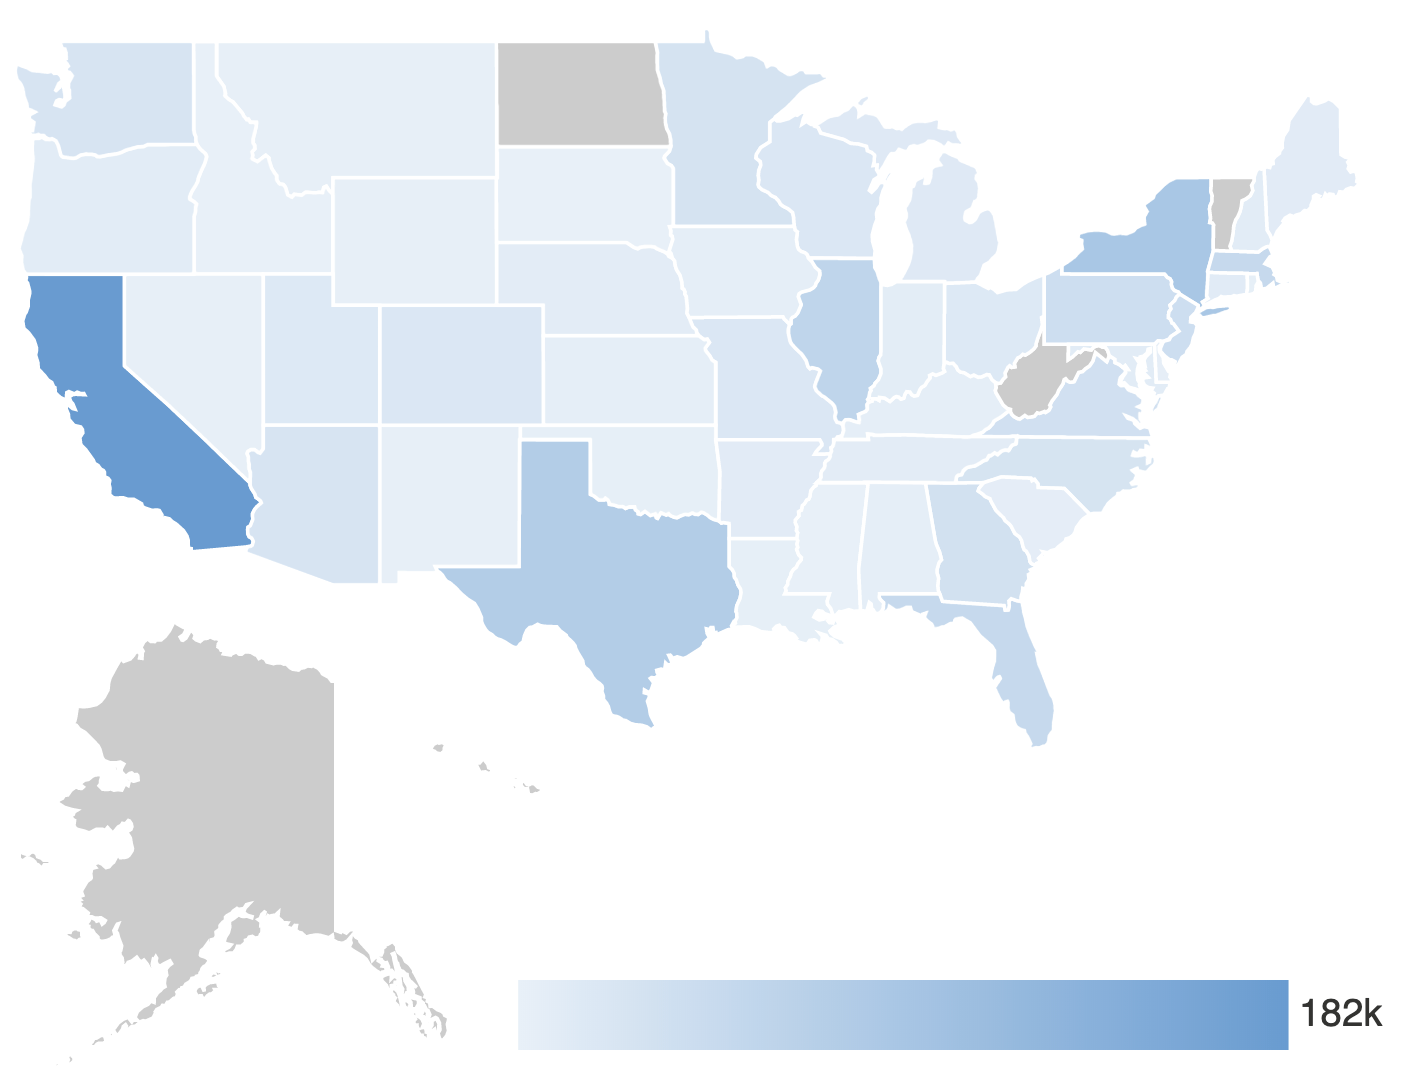
Where are your respondents? Our new report element ‘Map‘, lets you explore and visualize the locations of your respondents.
Geolocation of respondents visualized
You can pan around and zoom in. Hover over a country, state, province or city to see a count of respondents. The darker the color, the more respondents. Click on a country, state or province to zoom to a deeper level of detail.
Location filtering
The map only shows respondents that match the current filters. The map always starts at the widest view that can show all the locations of your respondents. You can have a map start at the country level by filtering that element to that country only.
Leave a Reply