An important phase of the research process is the presentation of results. One of the more engaging ways to present research results is through online dashboards. A dashboard provides a summary of the most important results or findings related to a particular subject in a visual way, arranged on a single web page.
Dashboards can be connected to live data that is automatically updated in real-time with results coming from one or more survey projects. So you are able to visualize and share key information, whenever you want and quicker than ever. A dashboard is easy to access via internet or intranet.
You can now create custom dashboards by using the embed charts function in our survey tool. Open the report with charts and filters. You can use (advanced) filtering to select for example certain answers to a question or the date responded or a demographic. Next you go to the chart that you want to use in your dashboard. Click on Share / embed. You now have two options. You can choose to share the link to this chart or you can copy a piece of code and paste it into a web page.
If you want to go even further, use our API to get raw data/statistics. That way you have total control over the lay-out.
More info:
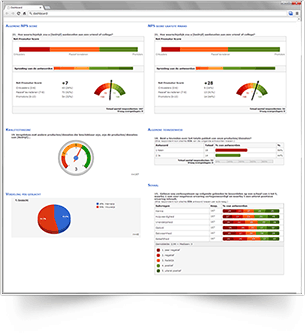
How can I build a dashboard?
Leave a Reply