An important phase of the research process is the presentation of results. One of the more engaging ways to present research results is through online dashboards. A dashboard provides a summary of the most important results or findings related to a particular subject in a visual way, arranged on a single web page.
Dashboards can be connected to live data that is automatically updated in real-time with results coming from one or more survey projects. So you are able to visualize and share key information, whenever you want and quicker than ever. A dashboard is easy to build in a CMS like SharePoint or WordPress. If you know HTML or have someone in your organization that does, you can even build more complex dashboards. If you want to go all the way, you can consume data from our API and present it any way you wish.
You can now create custom dashboards using the embed function in our reports. It works just like embedding a YouTube video. A great feature and something important to remember is that the embed code will reflect the filters that are set at that moment! This means that you can embed a chart for the same question multiple times, each with a different filter. For instance, a general statisfaction or NPS® question for the whole organization next to a chart for each department.
To start builing a dashboard, follow these steps:
- Sign in to CheckMarket.
- Go to the Surveys tab.
- Open your survey.
- Click on Analyze, and then on Report with charts.
- If necessary, set filters to include or exclude responses from certain respondents. The results will be refreshed. Only the responses are shown that match the selected criteria.
- Go to the chart you want to use in your dashboard.
- Click on
 on the right side above the question, and then on Share / Embed.
 - Copy the snippet of html code under Embed, and paste it in your Content Management System (e.g. SharePoint, etc.).

- Now open your CMS and find or create the page where you want to embed the code.
- Depending on the CMS, you are using, paste the embed code in your page. You can’t just add it as text. You need to add it to the HTML or use a embed iFrame function. For instance in SharePoint, follow these steps:
- Insert a Content Editor web part on the page.
- After choosing Modify the Shared Web Part, choose Source Editor in the tool pane.
- Paste the embed code in the window, then choose Save.
- The iFrame content displays in the Content Editor web part.
- Repeat the process for each question and each filter you need.
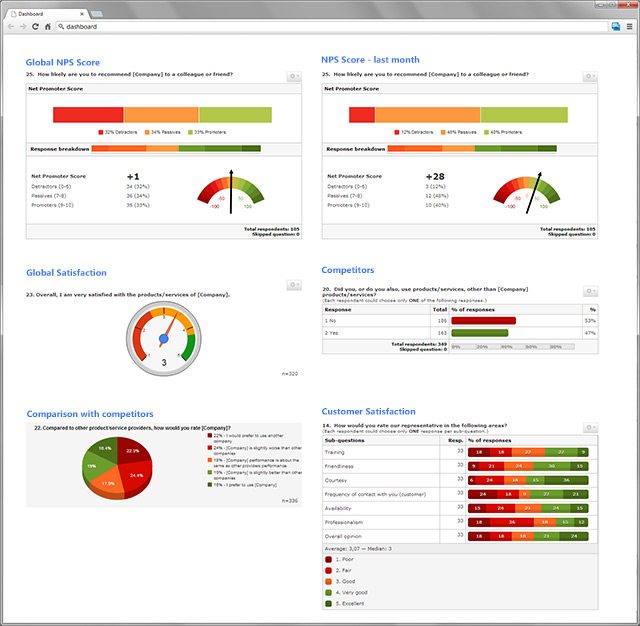
Here is an example of a dashboard built from the new embed function:
Net Promoter and NPS are registered service marks, and Net Promoter Score and Net Promoter System are service marks, of Bain & Company, Inc., Satmetrix Systems, Inc. and Fred Reichheld.
Leave a Reply