a new powerful tool to create shareable
reports and dashboards for your surveys
Get ready to wow your colleagues!
Two years in the making
We worked tirelessly for more than two years to build a reporting tool that gives you total control over every aspect of your reports, from the styling to which questions and chart types are used. You will be able to make multiple reports per survey and use our extensive new scripting language to add dynamic content in the conclusions you write around the charts.
Filters
Filters can be saved and reused. You can also apply filters to multiple levels: the entire report, a single chart, a specific share and more.
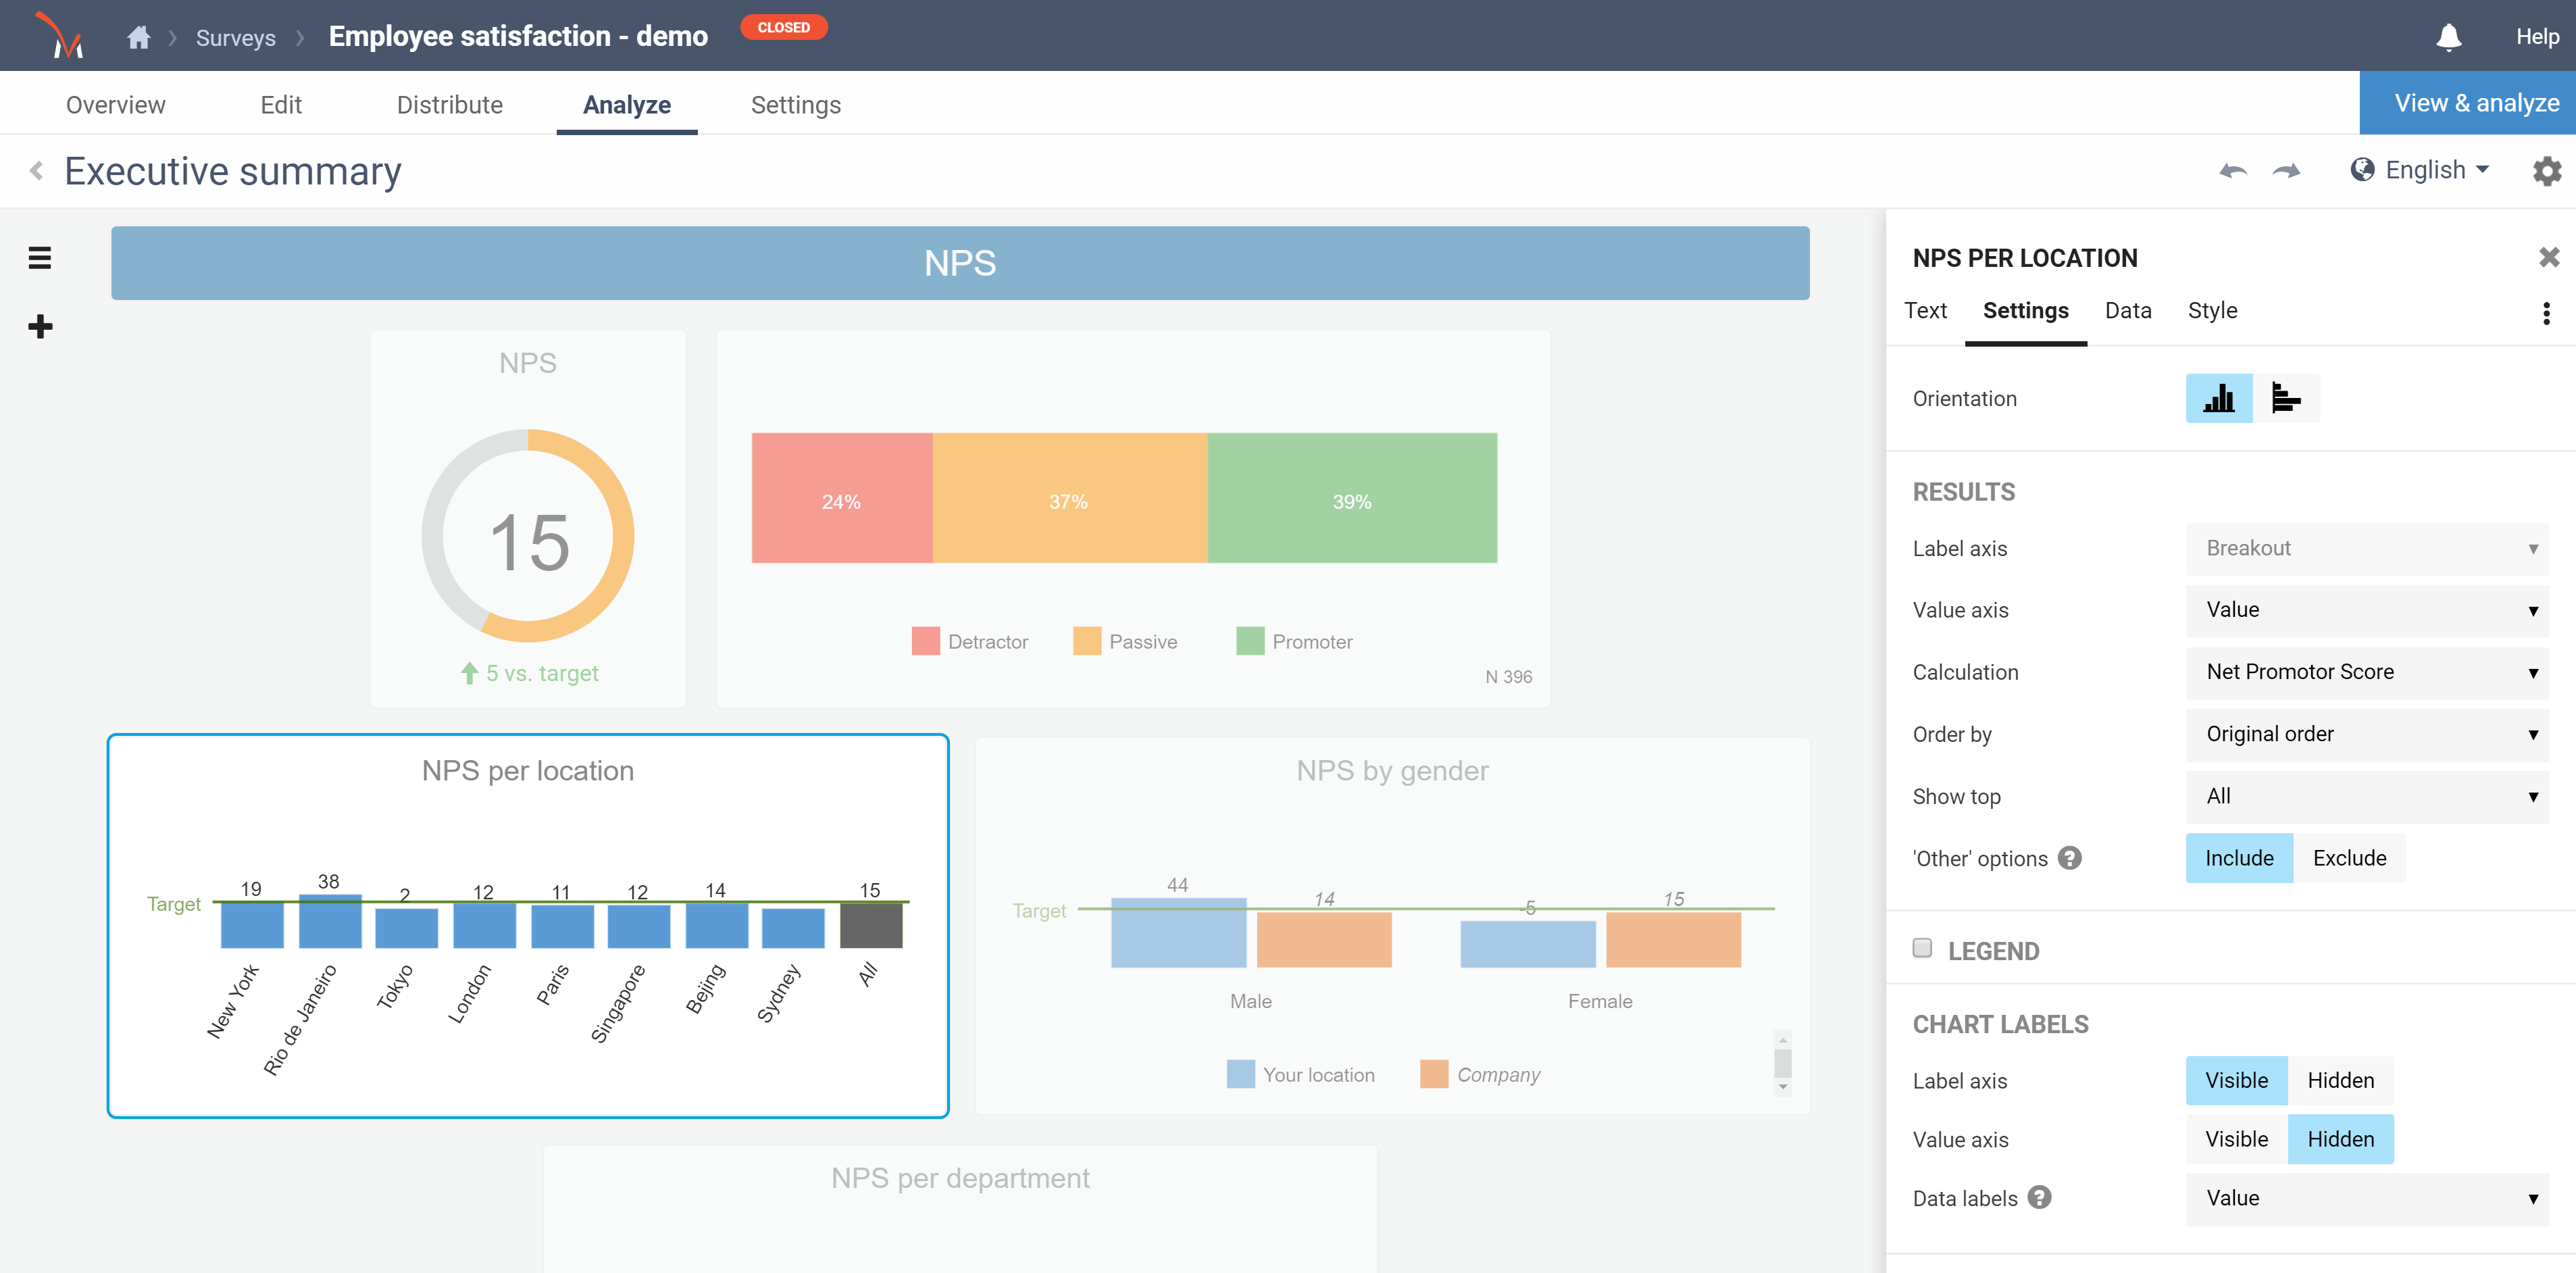
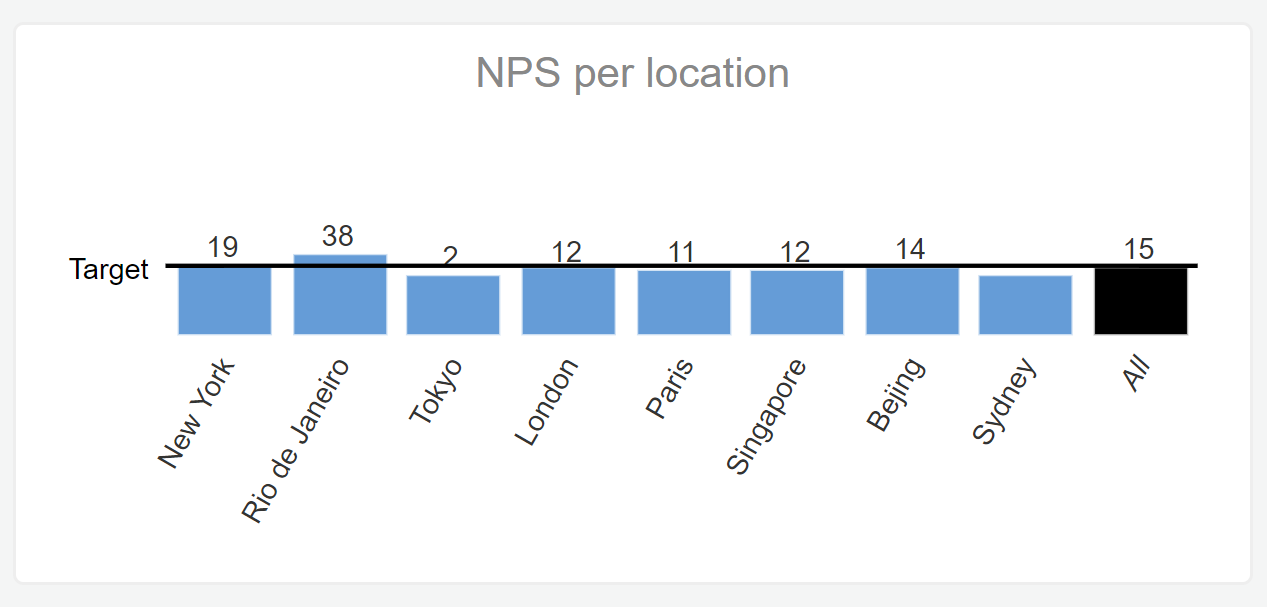
Breakouts
This is one of the most awesome features of the new report builder. It lets you take a score, like e.g. NPS, and ‘break it out‘ based on another question or custom field. For example, compare the NPS scores for different store locations or customer types. When you add a new store location, it will automatically be added to the breakout!
Benchmarks
You can add a benchmark to a chart to show a global score. For instance, show the combined NPS score for all stores next to the breakout of the individual store scores, or show the NPS score from last month vs this month.
Sharing
After you are done building an insightful report, share it with others. Create different share links, each with different filters, depending on what you want viewers to see.
That means if you want to have a report for each department or each region of your organization, you do not need to create 10 different reports. Instead, you build one report and then create 10 shares with each share filtered to only show the data for a region or department.
When you later decide to make a small change to the report, you only have to do it once and everyone will see the change.
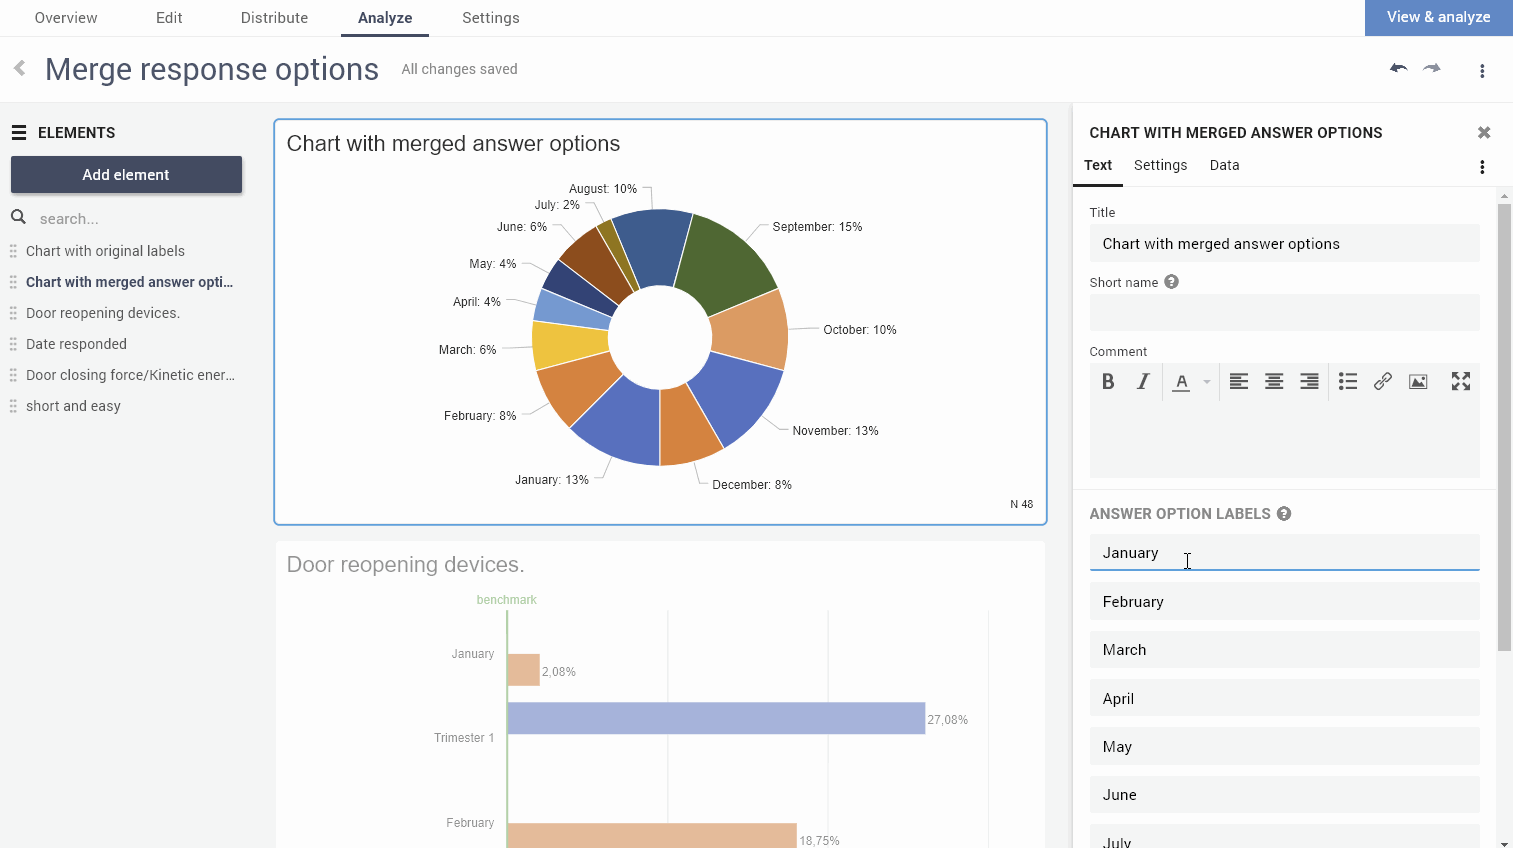
Merging
You can combine and merge answer choices, presenting them as one in a report element. To do so, simply give the answer options you want to group together, the exact same label. This will combine the results of those answer options and show them together under one unified label. This does not alter the underlying data or survey question.
CheckMarket Scripting Language
CheckMarket offers a powerful scripting language to enhance your reports.
At its most advanced, our scripting language gives you tremendous freedom to use complex logic to make calculations, show or hide certain blocks of texts or images and much more. For instance if the NPS from a region is less than the benchmark of the whole group, show them a message with action points, automatically.
What about our existing reporting tools?
They will remain. We are adding a new powerful ReportBuilder, without removing any existing features. The ‘Report with filters’ will be renamed ‘Quick View’.
Gradual rollout
These changes will be rolled out to all users in the next couple of weeks. Along with all that power comes some complexity. It is absolutely worth taking a few minutes to understand the major zones of the ReportBuilder, some key concepts and its terminology. We already have extensive documentation available including a ‘getting started‘ article, so don’t hesitate to immerse yourself ahead of time in the possibilities of our new ReportBuilder!
Leave a Reply