When creating a new panel using the CheckMarket Targeted Panel Manager, you will need to estimate the Incidence Rate (IR).
The IR, sometimes referred to as Qualification Rate, can be thought of as the percentage of people in a sample that qualify for a study. For instance, if you sent your survey to 100 people and only 7 people actually qualified for the study based on any screeners you had in place, your IR is 7%.
The IR will be a function of the target audience, the profiling data we have available using our demographic selections in the panel tool, and the questions designed to reach that target audience within the survey itself.
Why is it important to accurately estimate Incidence Rate?
It is important to provide an accurate estimate of the IR, as it is used to estimate and calculate the cost per incidence (cost per survey response). For example, let’s say that 90% of your survey participants will qualify for the study and you were quoted at $1 per response. Once the survey starts fielding, you notice that the actual qualification rate is 50% and your cost per response increased from $1 to $2. Your overall project cost would have to double in order to achieve your desired number of survey completes (responses). If you had accurately estimated the 50% IR upfront, your total estimated cost would have been more accurate and you would have had a better understanding of your overall budget and feasible number of responses.
Estimating Incidence Rate
When creating a new panel in CheckMarket, if you only use the selectable targeting criteria provided in the panel creation tool (e.g., Country, Gender, Age, and More Demographics selections), you can assume that our panel vendor has already accounted for these selections and, therefore, your IR should be around 100%.
If your survey has additional screening questions or quotas, you must take those into account when estimating the IR.
Refer to the following examples for some more guidance on estimating the IR for your project.
Example 1: Residents of the United States
- My demographic selections in the panel tool:
- United States residents
- 50% male, 50% female
- My additional screening questions and/or quotas:
- None
Incidence Rate: 100%. You can assume that the IR is 100%; however, there may be some drop-off for survey participants who have moved to different countries since initially taking the panel vendor’s demographic profiling survey.
Example 2: Residents of California
- My demographic selections in the panel tool:
- United States residents
- 50% male, 50% female
- Lives in California
- My additional screening questions and/or quotas:
- None
Incidence Rate: 100%. Even though we know that only 12% of the U.S. population lives in California, our IR does not have to take this into account since living in California is a selectable geo-targeting criteria in our panel tool, along with residents of the U.S. and gender balancing. If living in California was not available as a targeting attribute in our tool, we would have to add a screening question to disqualify non-California residents and set the IR as 12% to match the representative population. Also, we would expect the IR to be 100%; however, there may be some drop-off as some people could have moved out of California since answering the initial profiling questions.
Example 3: U.S. males who live in a place that has rained in the last 7 days
- My demographic selections in the panel tool:
- United States residents
- Male
- My additional screening questions and/or quotas:
- Has it rained in your area in the last 7 days? -> Must answer ‘Yes’
Incidence Rate: 20%. Assuming we looked at the previous forecast and found that 20% of the U.S. has experienced rain in the last 7 days, we would assume that only 20% of people would answer that question with “Yes”, so we need to account for that in our IR estimate.
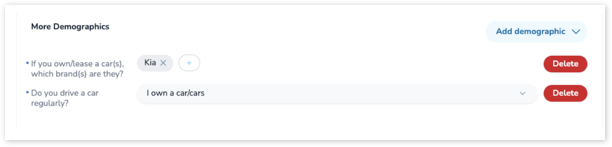
Example 4a: Kia owners in the United Kingdom
- My demographic selections in the panel tool:
- United Kingdom residents
- Male and Female
- Car owners
- Own or lease a Kia brand car
- My additional screening questions and/or quotas:
- None
Incidence Rate: 100%. You would expect 100% IR, but you may see some drop-off for people that no longer own/lease a Kia but did when they originally answered that profiling question.
Example 4b: Hybrid Kia owners in the United Kingdom
- My demographic selections in the panel tool:
- United Kingdom residents
- Male and Female
- Car owners
- Own or lease a Kia brand car
- My additional screening questions and/or quotas:
- Is your Kia a hybrid vehicle? -> Must answer ‘Yes’
Incidence Rate: 15%. Assuming that 15% of all Kia vehicles are hybrid vehicles, you would expect IR to be 15% if the IR/market share for UK Kia hybrids is 15%. However, the more screening that’s introduced, the more variance will be introduced. Hybrid vehicles tend to have a higher price point, so it’s likely that hybrid ownership will underindex among online survey panelists, generally speaking. In this case, you may want to consider using a lower number, such as 10%, as your IR.
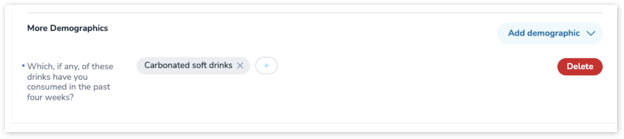
Example 5a: Root Beer drinkers in the United Kingdom
- My demographic selections in the panel tool:
- United Kingdom residents
- Male and Female
- Have consumed carbonated soft drinks in the past four weeks
- My additional screening questions and/or quotas:
- Have you consumed Root Beer in the past four weeks? -> Must answer “Yes”
Incidence Rate: 30%. Assuming that 30% of the UK’s population drinks Root Beer and already knowing that targeted panelists have consumed a carbonated soft drink the past four weeks, we could assume that roughly 30% of those panelists would have consumed Root Beer in that timeframe as well.
Another layer of complexity might introduce questions around brand usage in addition to consumption frequency. If we were looking for Root Beer drinkers but only those who had consumed a particular brand, such as A&W, we would be looking at a smaller percentage of that original 30%. This is where you either have to have some brand level data (e.g., market share data) or make some assumptions/estimations to determine what the IR should be.
If we were to say that we think around 25% of Root Beer Drinkers are A&W drinkers, our IR would then be 7.5% (30% * 25%). So if we sent the survey to 100 people, we would expect around 8 respondents to have consumed A&W Root Beer in the past four weeks.
It can get even more complicated and complex from there when you introduce age/gender/income/region quota requirements, because the consumption of Root Beer across those demographics might not be consistent; as such, there may be sub-group IRs that are going to impact the incidence rate as well. At a certain point, exact precision becomes less important and a general ballpark estimate is going to be about 90% as helpful as knowing the precise IR. What this means is that in this example, if we wanted to target past-month A&W Root Beer drinkers, we would say “it’s probably going to be around 5-10% IR” and leave it at that.
Leave a Reply