Filtering is a great way to narrow the results shown in your report, gaining new insights to how different demographics have responded to your survey, and to see how different variables are related. Sometimes, the filters we build are complicated by necessity, and we will want to reuse them later. You can save the filters in your report, so that you don’t need to rebuild them from scratch every time.
You can filter on questions, metadata that you passed to the survey or on respondent metadata that the system automatically captures, or any combination thereof.
Hierarchy
Understanding the hierarchy of how filters apply is the key to getting the most out of the ReportBuilder.
You can add filters on four levels:
- Report: This is the top level global filter. Setting a filter at this level affects all of the elements of your report. You can override this filter for a specific data source in an element, like a benchmark.
- Data source: Each element of your report has at least one data source. You can set a filter for each data source independently. If you set a filter at the element level and there is already a filter set at the report level, then the data source will respect both the report filter and its own filter, unless you set it to ignore other filters (benchmark).
- Share: A report can have multiple shares and each share can have its own filter. A share filter affects the entire report when it is viewed through the share URL. If there are filters set at the report level and/or data source level, then the share filter will respect those filters too unless you set a data source to ignore other filters (benchmark).
- Viewer: You can also give a viewer of a report the option of filtering deeper into the data. They cannot remove or override any other filters (report, data source, share), only filter down until they reach the minimum respondent limit (if one has been set).
Managing filters
Since filters can be reused in different places it is important to give filters a clear name that explains what the filter does. Using good names will make managing and reusing much easier. Also make sure to update the filter name if you edit a filter. If not, you may end up with a disconnect. For instance, you have a filter called ‘Last month’ that is actually filtering on last year.
Filters can be created and applied in multiple places in the ReportBuilder. No matter where a filter is created, you can manage them from one place.
- Go to the ReportBuilder and edit your report.
- Click on the cogwheel
 at the top-right and select Report.
 - Click on the Filters tab.
Now you see all the filters in the report and if a global filter has been set. You can see where each filter is being used by hovering your mouse pointer over the in use badge. You can also add, edit and delete filters here.
In the report editor, filters are not exclusive to a certain user. If user A creates a filter in a report, then user B will be able to see it and manage it too.
Editing a filter
Filters can be created in different places in the ReportBuilder. Once a filter has been created, it can be applied in different places too. You will find the option to add a filter anywhere you can apply filters, usually as the last option in the filter list. You can also add a filter, where filters are managed. When you click on the ‘Add filter button’, a drawer will slide up from the bottom. Let’s take a look at the layout of that drawer:
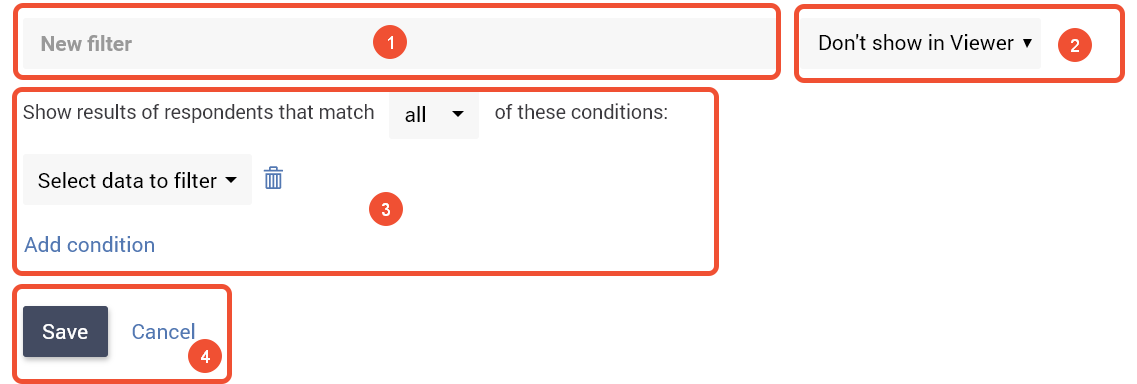
- Filter name: Give each filter a short and descriptive name that makes it clear what the filter does. Also, keep the name in sync if you change the conditions of the filter. For instance, a filter with the name ‘last month’ and filter condition changes to last year.
- Show in viewer: Some filters may be interesting for those viewing the report. By selecting this option, this filter will be available to viewers as a pre-built filter they can apply. You can find more details below.
- Conditions: This is where you set the criteria that respondents must match in order to get through the filter and be included.
- Save or Cancel: Once you are ready, you can either save the filter or cancel your changes.
Filter conditions
To be good at setting up conditions, you will need to put on your computational hat and think like a computer. This is pure logical thinking.
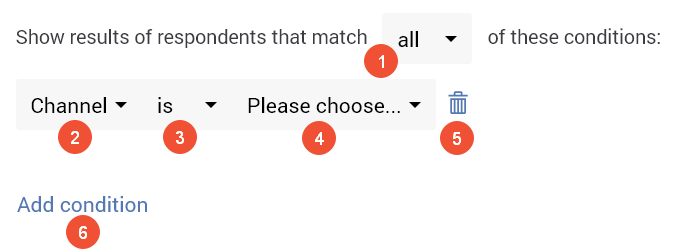
- Matching: Think of this as being ‘and’ & ‘or’.
- All: Only respondents for which all of the conditions are true will be included.
- Any: If any one or more of the conditions are true for a respondent, they will be included.
- Data source: What do you want to filter on? This can be a question, data you passed to the survey or metadata collected by the system.
- Operator: How would you like to test the data?
- Value: The value to compare to the data source.
- Trash: Remove this condition from this filter.
- Add condition: Add an additional condition to this filter.
Filter on report level
The filter you set on report level is the Global filter. It will apply to all elements in a report, expect for data sources that ignore other filters (benchmark).
- Go to the ReportBuilder and edit your report.
- Click on the cogwheel at the top right and select Options.
- Go to the Filters tab.
- Click on Add filter.
- Edit the filter as described above and click Save.
- Select the newly created filter in the Global filter drop-down menu in order to apply that filter to all of the elements in this report.
Filter on element level
In addition – or apart from – the global filter, you can also set filters only on certain elements. That means that only the selected element will be filtered based on the set conditions.
This way you can, for example, create the same chart multiple times, each with a different filter applied. A very common use-case is to show the average employee satisfaction scores across different departments. Change the element titles (via the text tab) or add Text & Media elements to clarify the difference between the filtered elements.
- Go to the ReportBuilder and edit your report.
- Click on the element you wish to filter.
- Go to the Data tab.
- In the Filter drop-down menu click on Add filter.
- Name the filter.
- Decide whether you want to show the filter in the Viewer or not. When you show it in the Viewer, anyone with access to a report share will be able to select that filter.
- Add one or more conditions. You can filter on respondent metadata, contact metadata, a survey question, or a combination of these.
- Select whether all or any of the conditions must be met.
- Click on Save.
The filter will immediately be applied to that element.
And when you select other elements you will see that the same filter will now also be available in the Filter drop-down menu. That way you can easily and quickly apply the same filter to multiple elements.
Filter on share level
When you are sharing results with different stakeholders, and you yourself wish to keep the high-level overview, you can apply filters only on share level.
For more information on shares and how to set these up, please read the “Share a report” article.
- Go to the ReportBuilder and edit your report.
- Click on the cogwheel in the top-right corner and click on Share.
- Click on Add share.
- In the Extra Filter drop-down menu click on Add filter.
- Name the filter.
- Decide whether you want to show the filter in the Viewer or not. When you show it in the Viewer, anyone with access to a report share will be able to select that filter.
- Add one or more conditions. You can filter on respondent metadata, contact metadata, a survey question, or a combination of these.
- Select whether all or any of the conditions must be met.
- Click on Save.
The filter will immediately be applied to the share. It will be applied together with the global filter if you have set one.
Filter Bar
Viewers of your reports are going to love how quickly and easily they can filter! As they click, the data adjusts in real time!
You choose the filters
You have total control over which criteria viewers can filter. You can select both questions and metadata. You can choose the order in which they appear and which label is used on the filter bar.
Multiple filters at the same time
Viewers can set multiple filters at the same time. For instance, if a viewer selects ‘last year’ from the ‘date’ dropdown and ‘AMEA’ for the ‘Region’, both filters will be applied to the report!
Filters respect the filters
For instance, in an HR survey report, a viewer can select a ‘department’ and then the next filter for ‘managers’ will only show managers that are in that department including the number of respondents.
Delete a filter
- Go to the ReportBuilder and edit your report.
- Click on the cogwheel in the top-right corner and click on Options.
- Go to the Filters tab.
- Click on the trash can
 next to the filter you wish to delete.
 - Confirm the deletion.
If you cannot click on the trash can icon, that means the filter is still in use. It will also have an in use indication. In that case, first remove the filter from the report or element where it is used and/or delete any shares where this filter is applied.
Common questions
The filter is still in use. Are you sure you want to delete it? De-select it from the report filters and/or element filters and delete the shares that use this filter, then try again.
Yes, you can! Once a filter has been created on any level, it will be available as a pre-defined filter on other levels as well.
At each level, you can apply only one filter. Say at the top level you apply a filter for ‘this year’ and then you create a share for each department, then the shared reports will only show data from this year for a specific department.
Each filter can have multiple conditions. So you could also create a global report filter that combines two or more conditions like ‘this year’ and ‘respondent level complete’. You could call it ‘Completes – this year’
Leave a Reply