
The Net Promoter ScoreSM (NPS®) is a simple but powerful tool to measure client satisfaction with one single question, an indication of the growth potential of your company or product. Read further for an overview on the use, application and pitfalls of NPS.
What is the Net Promoter Score?
The Net Promoter Score is a customer loyalty metric developed in 2003 by management consultant Fred Reichheld of Bain & Company in collaboration with the company Satmetrix. The objective was to determine a clear and easily interpretable customer satisfaction score which can be compared over time or between different industries.
The NPS assesses to what extent a respondent would recommend a certain company, product or service to his friends, relatives or colleagues. The idea is simple: if you like using a certain product or doing business with a particular company, you like to share this experience with others. Specifically, the respondent is asked the following “ultimate” question:
How likely are you to recommend company/brand/product X
to a friend/colleague/relative?
This can be answered on an 11-point rating scale, ranging from 0 (not at all likely) to 10 (extremely likely).
Calculation
Depending on the score that is given to the Net Promoter question, three categories of people can be distinguished:
- Promoters = respondents giving a 9 or 10 score
- Passives = respondents giving a 7 or 8 score
- Detractors = respondents giving a 0 to 6 score
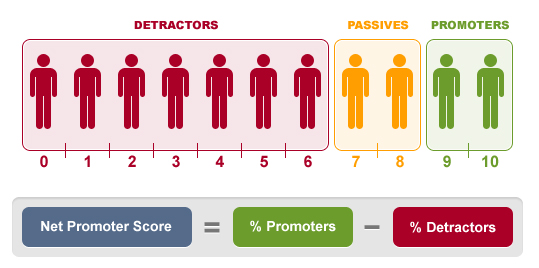
The Net Promoter Score is calculated as the difference between the percentage of Promoters and Detractors. The NPS is not expressed as a percentage but as an absolute number lying between -100 and +100.
For instance, if you have 25% Promoters, 55% Passives and 20% Detractors, the NPS will be +5. A positive NPS (>0) is generally considered as good.
Don’t make the common mistake of placing a percent sign (%) behind your NPS score, it is not a percentage.
What’s the average Net Promoter Score?
Nowadays, NPS is used by many large companies as a customer feedback tool. It gives your organization an unambiguous number that is easy to understand for all employees and useful as input for managers to steer the company. According to many people the NPS also gives a good indication of growth potential and customer loyalty for a company or product. You can track the evolution of the NPS over time, or compare it with a predetermined target. You can also benchmark different areas or products, or check where your company positions itself versus the industry average if this is available.
To give an indication: according to Reichheld the average American company scores less than +10 on the NPS, while the highest performing organizations are situated between +50 and +80. These values may however vary considerably from sector to sector and from culture to culture.
To understand the motives of Promoters and Detractors it is recommended to accompany the NPS question by one or more open questions that probe the underlying reasons behind the given score. This allows you to make the appropriate adjustments to increase the future NPS, either by boosting the percentage of Promoters, either by reducing the proportion of Passives and Detractors (or better yet, a combination of both).
NPS in the CheckMarket tool
To respond to the increasing popularity of the Net Promoter Score CheckMarket has decided to add the NPS question as standard question in the tool. If you want to use the NPS in your survey, the only thing you have to do is to select this question type. It is still possible to modify the formulation of the question or the naming of the endpoint value labels.
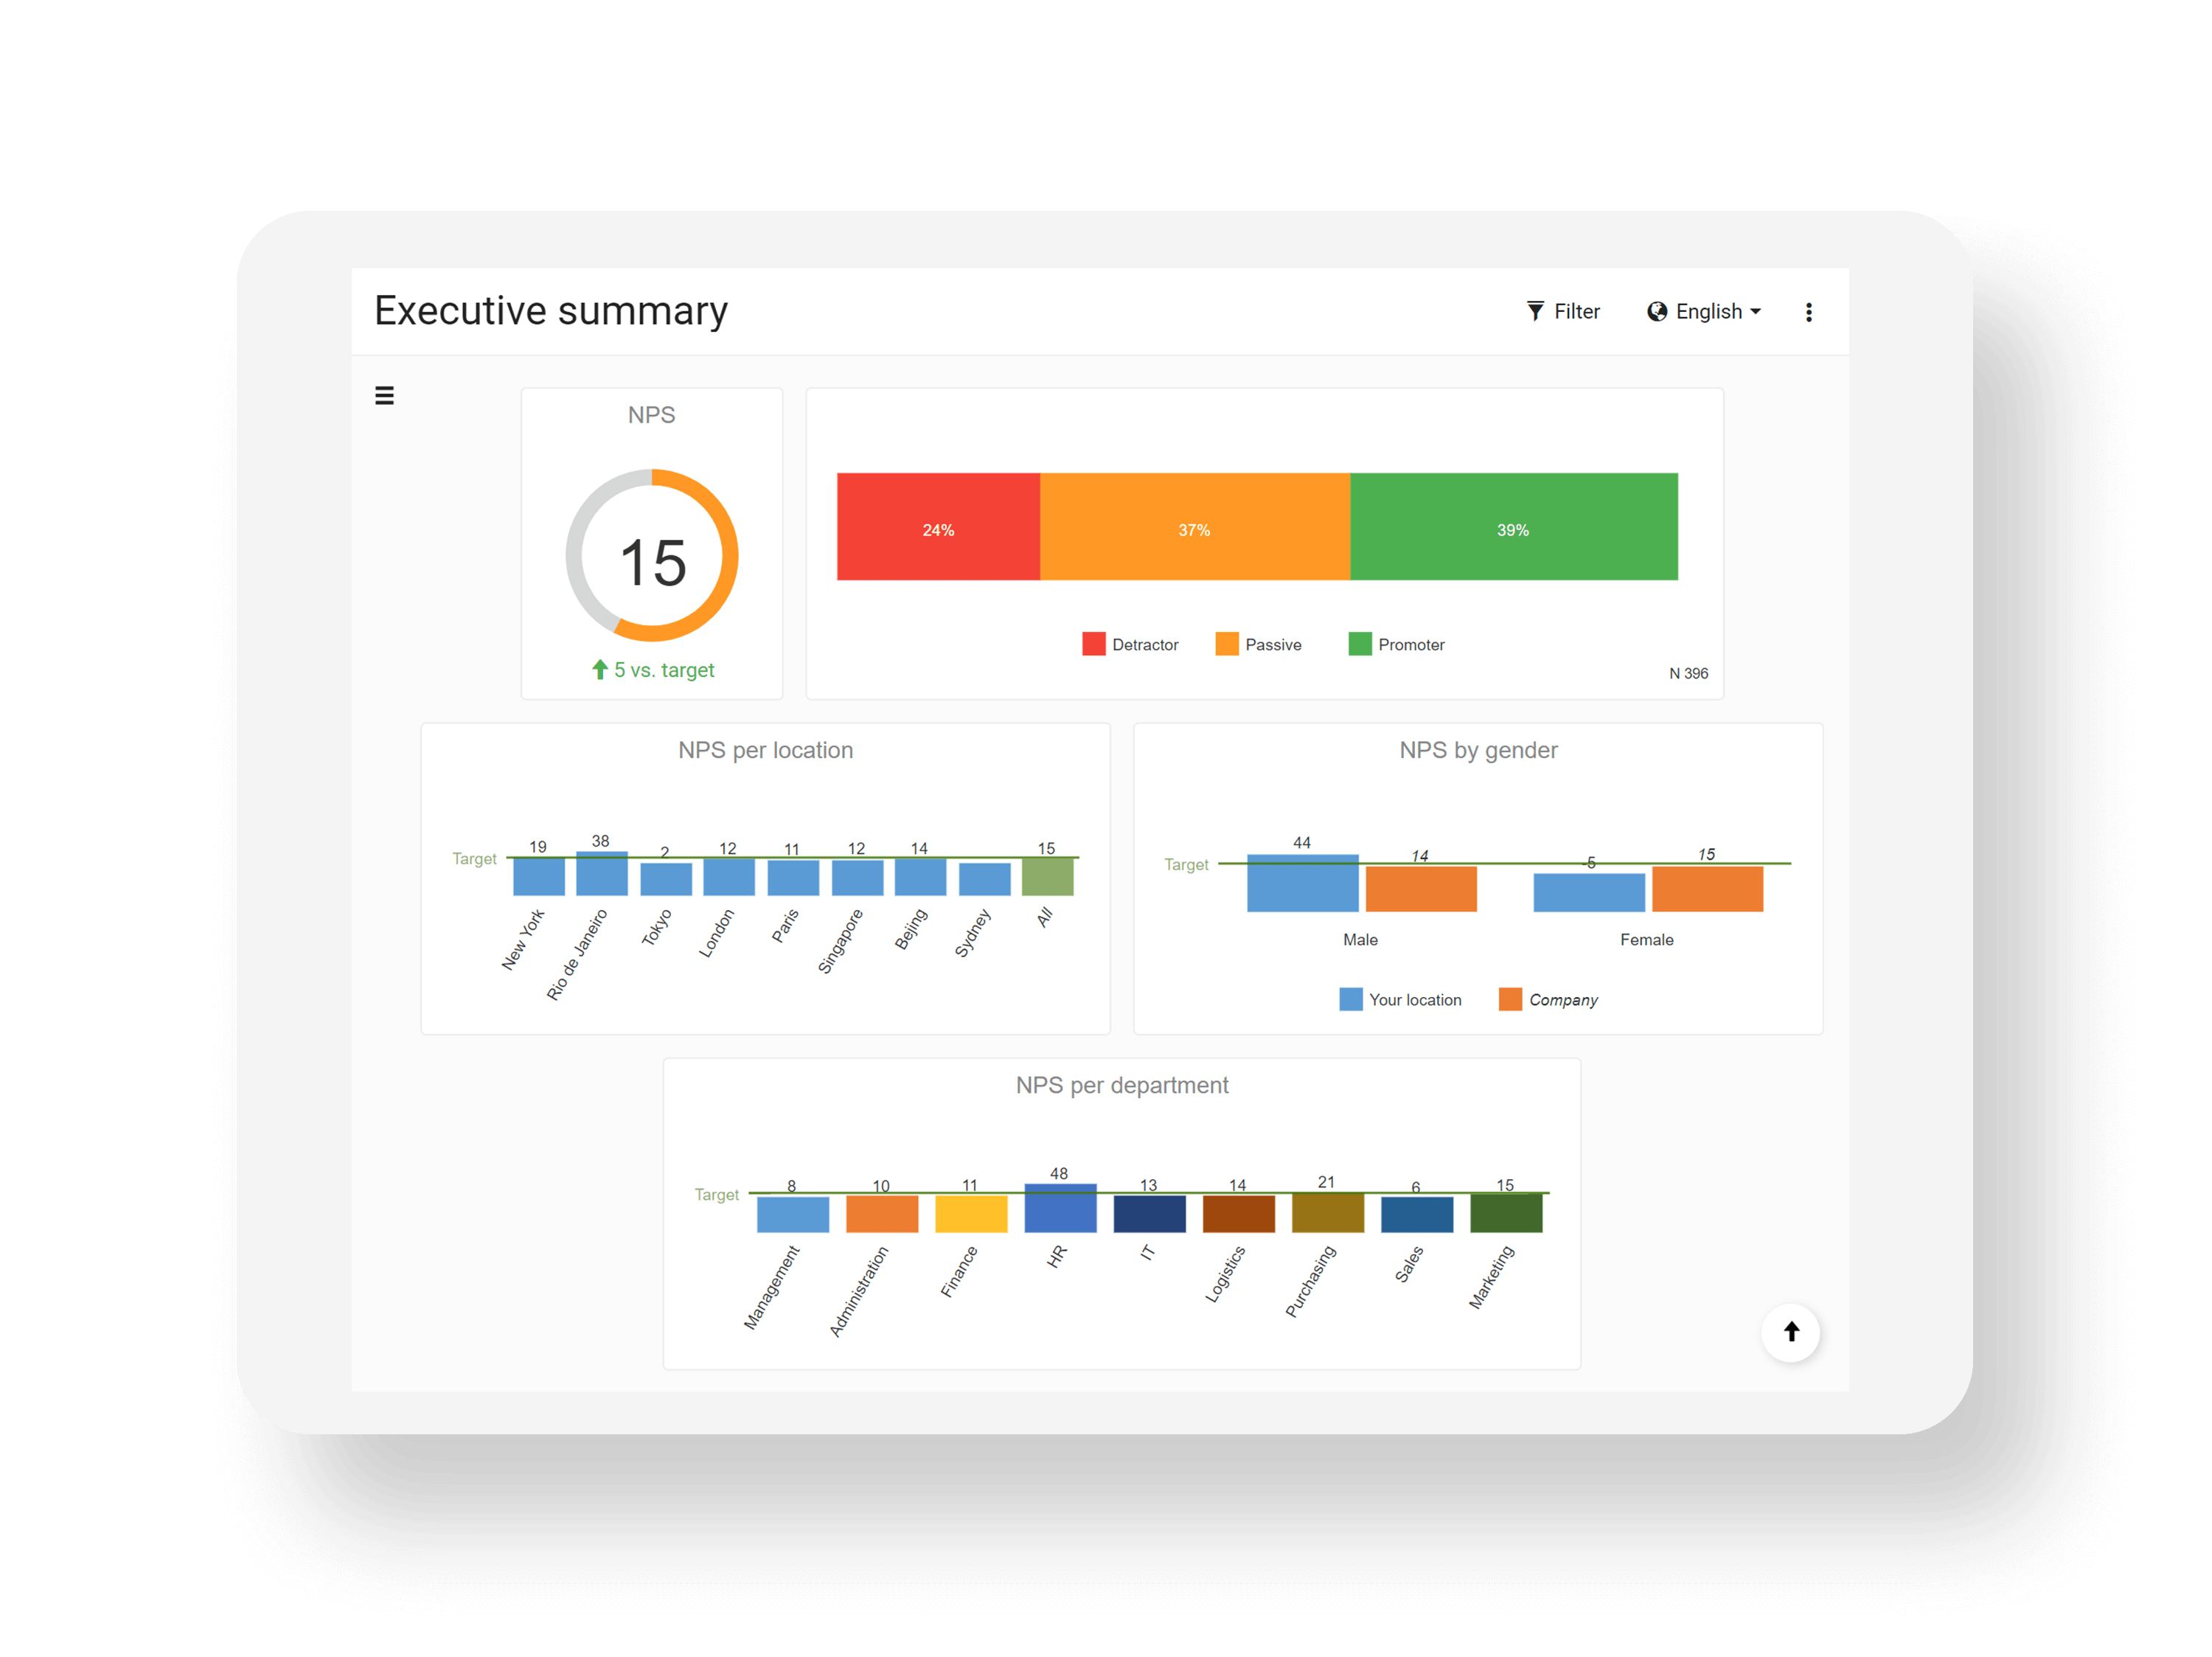
Once the responses start rolling in, you will see a bar chart in the reporting tool, showing the percentage of Detractors (red), Passives (orange) and Promoters (green). Under that is the detailed response distribution for the 11 possible scores. Based on these percentages, the actual NPS is calculated. Your NPS is represented on an easy-to-read gauge (showing positive NPS in green, negative in red). Enabling you to see at a glance how well your product or business is performing.
Some critical remarks
From a scientific perspective and in certain market research circles there is some skepticism about the NPS. Opponents of the NPS concept argue that there is insufficient scientific base for the outcome and that the model is too simple. They claim customer loyalty and satisfaction is not only about numbers and percentages, but also about causes, consequences and correlations.
It is also suggested that the NPS method cannot accurately measure customer behavior. Customers can claim they will recommend a company or product in a greater or lesser extent, but it is not proven they will actually do that in practice. Besides that, the recommendation of one customer is not always as valuable as that of another one. It is also a fact that the NPS is more useful in markets with a lot of competition where potential buyers have a greater tendency to ask friends or acquaintances for advice before deciding about a purchase. Another limitation of NPS is that it only takes into account customers, while also a lot of non-customers can act as detractors and generate bad word-of-mouth publicity.
Furthermore the NPS disregards important differences in the answer score distribution: no distinction is made between a 0 score and a 6 score, while there is obviously a substantial discrepancy between those two. It also makes no difference whether there are 70% Promoters and 30% Detractors or 40% Promoters and 0% Detractors. Both result in an NPS of +40 which doesn’t seem very logical.
Conclusion
Some caution is therefore required. It is obvious that the NPS on its own may not be sufficient as a management tool, but in the right framework and with some additional motivational questioning it can undoubtedly be a useful metric. Its greatest strength is the simplicity, making it functional and interpretable for every stakeholder. Considering the large number of big companies using this tool on a continuous basis, it certainly has proven its worth.
To be clear, NPS is only a starting point. After the analysis, the real work can begin: improving your organization and taking actions to boost your NPS. This will be a long term project, but the NPS allows you to perfectly assess at which stage your organization is in this growth process.
Net Promoter and NPS are registered service marks, and Net Promoter Score and Net Promoter System are service marks, of Bain & Company, Inc., Satmetrix Systems, Inc. and Fred Reichheld
More on Net Promotor Score?
- Net Promoter Score Software
- Watch the recording of our Net Promoter Score webinars:
NPS – Advanced Workflow
NPS – Get everybody involved - NPS clearly explained in 14 slides (Slideshare)
- Look at sample NPS survey results
(Password to access results: NPScore) - Use our NPS Calculator
- How to turn NPS passives into promoters
- How to turn NPS detractors into promoters
252 comments
Join the conversationAudintel - December, 2021
Great analysis on net promoter score. Thanks for sharing….
Supplier management - March, 2021
The article is very informative which is worth reading it . Thanks for sharing
Ferdie - January, 2021
Hi There. Is there anyone out there that knows the calculation to put in an excel/google sheet that can calculate how many promoters are needed to get to a certain goal. I know I can just keep guessing until I get it right, but there has got to be a formula that I can plug in to the sheet that will do it for me. I know the calculation on how to get the score, but I need the calculation on how to get a target number. The tricky part I am running into is that the NPS total score changes due to the total number of surveys and any detractor or neutral will effect that. Any help is appreciated. Thanks!
Melinda Johns - December, 2020
I’ve been researching this topic lately and found your easy to read and understand article! Thank you for putting it together! It does keep bringing value to its readers even in 2020! Another question I had on this topic was “When is is the right time to send NPS survey”, the answer to which I happened to find in this blog post https://blog.coupler.io/net-promoter-score-calculation/ So I highly recommended it as well!
Ben Arrowsmith - November, 2020
Hi, I am currently analyzing our NPS scores as a whole and comparing them to the scores across individual products. When I take the overall NPS score, it is different to the average of the NPS scores across the different products. I assume this is due to having fewer responses for some products which has therefore created a skewed NPS in some instances, is this correct?
I also assume therefore that the overall NPS is still the more accurate result but the individual scores are not necessarily ‘incorrect’ either?
Gert Van Dessel - December, 2020
Hi Ben,
Sorry for the late reply.
You are correct, you cannot take an average of the individuel NPS scores per product to get the global NPS, you have to take the weighted average based on the number of respondents per product.
Nevertheless, your global NPS and individual NPS scores as such will be correct.
Simon - January, 2021
Hi, This is a great blog – wish I had found it earlier! We have started to ask for an NPS score in our quarterly customer survey. Having read your blog we are not getting enough responses for it to be of an acceptable accuracy level (typically we are getting 50-75 responses per country per qtr). I have purposely kept away from combining the scores of different countries across Europe due to the cultural differences. I don’t want to reduce the frequency of surveys as it is great to have a regular pulse on progress and I have also tried many different ways to increase our responses rates but getting to 150+ doesn’t seem realistic. What would you recommend as the best way forward? For example combining with previous Qtr scores to get a rolling average? Is this feasible? Any other ideas / recommendations? Thanks in advance
Gert Van Dessel - January, 2021
Hi Simon,
If youir response rate is not sufficient to compare quartterly results, you can compare semesters or, if you want a quarterly update us a rolling average as you suggest.
You can track a quarterly global NPS score to detect general trends, but, as you state correctly, due to the cultural differences, in the end you will have to go in detail to investigate evolutions per country.
Matt - January, 2020
Hello, my team has just piloted an NPS survey for our employees who use our internal IT department. Basically, anytime they put in a ticket we send them an NPS survey (along with a few other questions). After reviewing some initial feedback, some respondents are echoing my thoughts about the contradictory nature in asking to “recommend” the internal IT department to a fellow coworker because there is no other choice in the matter (e.g., if you need to get your password reset, you HAVE to contact us). Thus, a respondent could put a 10 for “recommend”, while their satisfaction with the experience was a 0 (and this was an actual comment we received).
So, is an NPS question still viable in this type of “customer” and “company” relationship? Is there any sort of word-smithing that could make the question more logical while still retaining the purpose of an NPS question (e.g., “How likely are you to recommend to a colleague that you had a positive experience with IT for this ticket?”)? Or would it be better to use a more straight forward satisfaction question?
At the end of the day, I know we’ll still received lots of great feedback and be able to make changes for better experiences, but I can’t help but wonder if we would receive better feedback and a more meaningful score with a more logical question.
Thanks in advance!
Alexander Dobronte - February, 2020
Great question, Matt! NPS is popular because of its simplicity. It is sometimes like having a hammer, all of a sudden, everything looks like a nail. We agree that NPS is not the right question to be asking here. Since employees have no choice,’recommending’ a ‘different IT department’ is not an option;) A question we like to use in this case, would be a Customer Effort Score (CES). “IT support made it easy to handle my issue” (7 point scale). Strongly disagree to Strongly agree.
You can even go more simple, just asking if they were satisfied with the issue handling, yes or no. That lets you do triage further in the survey and follow-up and it is easy to answer for a respondent. To get the highest response rate, both questions should be embedded directly in the email notification when the ticket is closed to make it as easy to answer as possible.
We have best practice templates for NPS, CES and Post-contact surveys. So create an account and try them out. Good luck!
Ian Koxvold - September, 2019
The issue that I find most fascinating is the difference in NPS score depending on whether you ask about yourself or about someone else. I have many times multiple surveys covering the same company, where the one they ran gives them an NPS score c.40-50 points higher than the ones run by third parties.
This is pretty intuitive – it turns out that you’re more likely to say I’m a nice guy if I ask you than you are if some random person asks you.
This has a couple of implications. It’s fine if you want to look at how NPS varies by customer segment, or over time. It’s very misleading if you are comparing your NPS to your competitors (when you ran the survey).
Alexander Dobronte - September, 2019
That is good point. That phenomenon is a type of response bias called demand characteristics bias. Respondents can take on a ‘apprehensive-participant role’ and want to behave in a socially desirable way. It is one of the reasons we do not encourage our clients to use NPS benchmark data. NPS is best used as a triage mechanism to obtain details about what works and what is not working for your company or product. Find out what detractors are not liking and get that information deep into your organization to affect change. The same for what promoters like so much, also get that information deep into your organization so that it can be replicated with other customers.
greenkr1 - May, 2019
We’ve got several clients who are pushing to apply the NPS scale to non-NPS questions (they want to use it to measure all variables). Is this recommended? Are there pitfalls? It seems that the NPS scale is designed to ask a specific question – and provide a specific interpretation of the answers. Looking for some guidance on if applying it in other scenarios is recommended. Thanks!
Gert Van Dessel - May, 2019
The NPS scale is specifically designed to measure customer experience and predict business growth based on the calculated NPS score.
I would not recommend using this for other purposes. You will get a score of course, but this has no real meaning in another context.
Fraction.Calc - April, 2019
This NPS tool is very helpful in determining whether your business is growing or losing. I guess this is very important to business people and executives.
Nicholas - April, 2019
Hey there. Would love to have some support over here. I’m running a survey to calculate the NPS score for people who just bought their house at Sengkang Central Residences. We created a survey form with Surveygizmo. Right now, I have data in an Excel but I’m wondering how can I translate into a more readable format?
Gert Van Dessel - April, 2019
Hi Nicolas,
I suggest to use CheckMarket for your future surveys.
NPS uis a standard question type in our tool, and we have built-in reports where NPS score is already calculated automatically.
Allen - March, 2019
Hi, thank you for the great info.
I am working in a team that offering different services to others teams in our company.
We got some issues when we ask our customers ‘how do you recommend ‘our team’s name’ to your friend’ because our customers are just familiar with the services we are offering and have no idea of what our team is.
For example, we are running agile trainings across Technology. It is reasonable to ask them ‘how do you recommend our agile trainings to your friend’. But will make them confused if we ask ‘how do you recommend ‘our team’s name’. So in this case, how can we get the right NPS at a team level and not just for a service we are offering? Or if we can get NPS for each of the services we are offering and combine them together, is it an appropriate way to reflect on our team’s NPS? (a little bit similar to the question below)
Gert Van Dessel - April, 2019
Hi Allen,
You are correct it makes no sense to ask for a NPS score for a particular team when your customers are not familiar with the team names.
But if you know the relevant team for each of your customers, you can use this as background data, and afterwards you can filter on your results to get the NPS score per team.
When you use our survey tool to distribute your survey, you can import an Excel file with all relevant information per customer (including the name of the relevant team).
The team name per contact will be imported (together with customer name and e-mail address + other relevant info) and is available in our tool for further analysis.
Ruben - March, 2019
Hi, thanks for the information.
In my company we currently measured nps per customer touchpoint (sales, onboarding, service, etc).
What is the appropriate way to resume all local nps indicators into a single measures?
My company is in the SaaS industry.
Gert Van Dessel - March, 2019
Hi Ruben,
The methodogically correct option is to calculate your global NPS based on all underlying scores coming from your total sample.
However, if you want to allocate equal weight to each touchpoint, you can calculate the average of NPS scores for the touchpoints.
Or, if the response rate per touchpoint differs considerably, it would also be an options to calculate weighted averages based on the total population per touchpoint.
Most important is to keep the methodoloy for calculation consistent over time.
Marcella Colombino - December, 2018
Hi Gert,
I have a question regarding population.
I work in a B2B environment, in my CRM I have 2’000 companies, 10’000 customers, but only 5’000 email addresses/telefone numbers.
My population for Sample calculation should be what? The 2’000 companies, the 10’000 customers or the 5’000 usable “contacts”? Very curious about your answer.
Marcella
Gert Van Dessel - December, 2018
Hi Marcella,
This depends on the objectives of your research. If your study is on a company level (you want one response from a relevant contact person per company), then your population will be 2000.
If your object of interest are the customers themselves (you want as many answers as possible, which means multiple per company if possible, then your population will be 10000 (so not only the 5000 usable contacts).
Neeraj - April, 2019
Hello
If there are 100 promotors which achieve 25% score. How many promotors are required to achieve 30% score?
Gert Van Dessel - April, 2019
This depends on the number of passives and detractors.
Irfan Warsi - December, 2018
Hi
I can even use this process to monitor the quality/ratings of the delivery Rider. Right?
Gert Van Dessel - December, 2018
Hi Irfan,
Yes, it is perfectly possible to use the NPS score for that purpose.
John E - October, 2018
Thanku!Its so helpful article Related to NPS Your calculation is impact positively by which we can conduct more surveys
Priyesh - September, 2018
If we have number of detractors, number of neutrals and nps score. And want to get the promoters number then what will be the calculations??
Gert Van Dessel - September, 2018
Hi Priyesh,
To calculate the number of promoters (P), you start from the following equation:
NPS=(P-D)/(D+N+P)x100 with D = Nr. of Detractors and N = Nr. of Neutrals
After some calculations, you get the following formula for the number of promoters:
P=(D*NPS+N*NPS+100D)/(100-NPS)
For example, if you have 100 Detractors, 400 Neutrals and NPS = 40
P = (100*40+400*40+100*100)/(100-40) = 30000/60 = 500
Tolu - May, 2018
Dear Team
Please what happens to NPS score when you have 100% passive rating i.e no Promoters and no detractors
Gert Van Dessel - May, 2018
In that case your NPS score will be 0 (0% promoters – 0% detractors)
Mike Price - May, 2018
Gert,
Two questions. First, if a canceled customer is accidentally called, does this score stand? And second, are the circumstances, such as rudeness or mistakes that that the survey taker may make (or others), that would cause the score to be removed from the statistics? I’m told that ‘real’ surveys leave all responses in regardless of the circumstances.
Gert Van Dessel - May, 2018
Hello Mike,
Sorry for the late reply and thanks for the interesting questions.
I personally would leave anything out that could disturb the objective measurement of your NPS score.
The advantage of measuring the NPS via an online survey is that there is no influence of the interviewer.
And I would advise to try to make your respondent base large enough. This limits the impact of potential ‘mistakes’ to a absolute minimum.
hardip Davda - February, 2017
HI, Lots of information on nps, we want to know we are in online travel portal company.
what could be the best time to ask for NPS? after booking tickets? or after he travelled? because it may get negative response based on consumer experience with that travel company.
IS NPS for online site, right? so shall we ask the consumer post booking done?
Gert Van Dessel - March, 2017
Hi Davda,
This depends on which part of the process you want to evaluate. If it’s only the booking process, it’s best to ask the question directly after the (online) booking process.
If you want to evaluate the whole travel experience, you should ask after the journey.
Fredwar Sequera - December, 2016
Hey Gert!
So, I ran an NPS score on my project 3 months ago. In it I had 57 responses scoring a solid +3.5 NPS back then. We’re at the end of the semester and I ran it again, this time having 86 responses and scoring a solid 0, 23% detractors, 23% promoters and 40% passive clients. My question goes towards this “passive” clients, several of them are obvious and confirmed promoters of my project, they’ve reccommended it to friends and are spreading the word as to how our project is an experience everyone should be part of, and this people have given us a scor of 7-8 (mostly 8) So I’d like to know if there is some sort of study with which I can prove or consider 8 as a promoter and not as a passive. Keeping in mind that I’m running an NPS study on people who come from Europe, Asia, America, etc.
Gert Van Dessel - December, 2016
Fredwar,
Thanks for your comment. NPS is a standardized methodology, so for uniformity reasons and benchmarking you have to accept that clients giving a 7-8 score are considered as passives.
Of course it is possible that some of the passives will recommend you to their friends/families, but it might as well be that some of your promoters giving a 9-10 never speak to anyone about your product. Most important for your NPS follow-up is the evolution over time. Which actions can you undertake to turn your detractors into passives and passives into promoters? With a little extra effort you might change an 8 score to a 9 or 10.
Roy - October, 2016
Hi Gert. I’m curious as to what moving average to use as a reporting tool for NPS.
Do I just use the regular moving average (average over 3 months including the last one), or do I use a weighted version? And in case of a weighted moving average. How is this calculated? Because f.e. the last 3 months my scores have been -13, +6 and +1. But the respondents over those months were differently aswell, the first month (-13) had 67 responses, the second (+6) had 77 responses and the last month (+1) had 84 responses.
Should this be of any influence to the way the weighted moving average is calculated?
The only formula I’ve seen so far is (X * 0,5 + X-1 * 0,3 + X-2 * 0,2)/3. But this wouldn’t take in account that the latest month has more responses and thus is more stabilized than the months before that.
Gert Van Dessel - October, 2016
Roy,
I would use a moving average weighed by the number of respondents per month.
In your case, the formula to use would be:
(67*NPS1+77*NPS2+84*NPS3)/(67+77+84)
which gives -1.4 as a result for yuor moving average NPS
Greg - September, 2016
Hello. I was wondering if it would be in good practice to show where the promoters, passives, and detractors are in the scale when asking the question? Or would this taint the results?
Thanks.
Gert Van Dessel - September, 2016
Hi Greg,
We strongly recommend not to do this, as experience from the past shows that this results in biased (more specific – higher) NPS scores.
If you want to benchmark with other NPS scores, you need to use the standardized methodology.
Vijay - September, 2016
How to get customer recommendations for NPS when product sold through dealers/distributors?
Gert Van Dessel - September, 2016
Vijay,
If you have access to the customer database of your dealers/distributors, you can send out your NPS survey yourself the the email contacts in these databases.
The other option is that the dealers send out the survey themselves, for instance linked on a transaction (purchase or delivery of the purchased goods).
If you include the dealer info in your database, you can filter afterwards and compare results for the different dealers (easy to do in the standard reporting module in our survey tool).
Vijay - September, 2016
Thanks Gert.
Some of the consumable products have been sold by multiple levels of sub dealers, where the bottom level sub dealers don’t want to disclose their customer details or properly maintain.
(for example some branded shoes are sold by local sub distributors at multiple level in depth)
Like to know the current practice in such scenario.
Gert Van Dessel - September, 2016
Vijay,
If you don’t have contact details of your customers, you can try to distribute the survey via your company’s website or social media channels you have developed for the different brands.
Or hang out posters in the local stores with QR-codes, or put QR-codes on the purchase bill, advertising flyers, …
Barry - May, 2016
Hi Gert,
When I stay at a hotel on popular websites, they ask me “would you recommend this place to a friend – yes or no”. Often times these hotels have a 80-90% “recommendation” score (although I completely understand that everyone that answered yes is likely not a promotor).. Regardless, I want to compare NPS to be able to benchmark with these types of results. What would be an appropriate scale for this comparison (for example, anything above a 5 would be a “yes”)?
I hope this makes sense!
Gert Van Dessel - June, 2016
Barry,
Because you use two completely different scales, any comparison would be arbitrary. For me, a 6 score for a hotel would not be a recommendation to visit it.
I would look for hotels that have at least an average score of 8 or more.
Barry - June, 2016
So it would not be correct to say the upper half of the numbers on the scale would represent a “yes” and the lower half would be a “no”?
Gert Van Dessel - June, 2016
Barry,
No, it would not be correct to say that someone who gives you a score of 6 out of then would automatically recommend your hotel.
In the definition of the NPS, only the ones giving 9-10 scores are real promoters.
Lane Tapley - May, 2016
i have b2b client with 300 customers – assume this is too small a base to measure NPS, are there other metrics i could use for small base
Gert Van Dessel - May, 2016
Lane,
If you could achieve a 50% response rate (150 responses), you can already use NPS as an indication of how your client is doing. You just have to make sure to be careful with the interpretation and try to make optimal use of the wording in the comments > why would respondents (not) recommend your client?
John - May, 2016
What is the minimum number of respondents necessary for a validated NPS? In our example, we want to use NPS for the members of an athletic team, and team members can range from 8-100 depending on the sport.
Thanks!
Gert Van Dessel - May, 2016
Hi John,
To have any statistical relevance, I would go for a minimum of 100 (ideally you need 300), so probably you will have to combine different sports to get to this number.
John - May, 2016
So what if a team only has 10-30 members? Can the NPS still be used? It would be hard to combine sports with different coaches.
Gert Van Dessel - June, 2016
John,
You can always use NPS as an indication, but you cannot attach any statistical value on the results. More important are the verbatims > why would your respondents recommend/not recommend a certain sport.
John - June, 2016
But what if your team has 15 members, and you have a response from every single member?
Gert Van Dessel - June, 2016
John,
If you have a 100% response rate, you can use the NPS score for this group, as your margin of error is 0 in that case.
Richard - June, 2016
Hi,
The company I work for uses service tick and it is part of how we as employees are measured.
The company uses a 1-10 measure with 9-10 promoters, 7-8 Passive, 0-6 Detractors.
The Company has put down certain parameters:
50% of all customer interactions should be put through to the service tick survey.
Expected usage of word patterns such as:
“As I mentioned in the begining of the call, I will like to get some feedback on how you feel the call has gone today. You will asked to rate me between 1 – 10. 1-8 meaning I have not met your expectations today and 9-10 meaning we have covered what you wanted and I have met your expectations.
The first question in the survey “would you recommend us to friends” is a hypothetical question based on the service that I have provided, if someone were to ask you about our service, would you recommend me?”
My questions are as follows:
1) We are expected to “cherry pick” the positive clients. I.e. if you know they are not overly happy you do not put them through – hence the 50% measure of clients being put through.
If we are “cherry picking” what use is the survey if you are putting through only what you think is a promoter?
To get real value from the survey potential promoters and detractors should be put through to get a “real” score or feel?
2) The usage of the word patterns above? I think this word pattern tries to place words in the client’s mouth before they have even gone into the survey? What are your thoughts on this?
Many thanks
Richard
Gert Van Dessel - June, 2016
Hi Richard,
I completely agree with you. Any attempt to steer your answers in a certain direction (positive in this case) will undermine the value of your NPS measurement and bias the results.
The only correct way to use the NPS question is to ask the question ‘as such’ with the standardized formulation. Your selection of respondents should be random. If you want to sample 50% of your client base, you can interview your 1st, 3rd, 5th client etc.
Jennifer - March, 2016
Also, some of my NPS surveys come back blank – do you know why this is?
Jennifer - March, 2016
I would like to know – for the formula is it the total number of surveys divided by the total number of promoters (or detractors) – or is it only the total number of surveys received for the promoters and detractors divided by the total number of promoters (or detractors). For Example – I have 12 detractors, 3 passives, 15 promoters. would I only count 27 surveys for the NPS or would I count all 30? Would My NPS be 10 or 11?
Jennifer - March, 2016
NVM – I found my answer via google – But the second question is do I count the blank surveys and do you know why they come back blank?
Nadia De Vriendt - March, 2016
hi Jennifer,
Is it possible you didn’t mark the NPS question as required? I couldn’t immediately find an account under your name, so I can’t verify at the moment. If you provide the survey name or your account name to our support team, we’ll have a closer look.
Thank you!
Jared - March, 2016
Dear Gert,
Do you have any suggestions on good tag lines that could be used to ask for promoters……because I give you a 10! :0
Also have you found any successful ways to encourage the promoters to take the surveys vs just the negative ones? You are the best!
Gert Van Dessel - March, 2016
Hi Jared,
If you want a realistic NPS score for your company, this has to be based on a representative sample of your customer database. If you are trying to find ways to attract as many promotors as possible to fill in your NPS survey, you will not have a representative sample and your results will be biased. If you want to improve your NPS score, you do this by taking actions to improve your customer service. If you succeed in doing this, you automatically will have more promotors who will be glad to fill in you survey because they are so enthousiastic about your product/service. In a follow up question you can ask why they are so impressed with your company and you can post their comments on your website to attract new customers.
Lin - February, 2016
Is NPS software that you download or install on your site or are they just questions you ask during research?
Gert Van Dessel - February, 2016
Lin,
This is a question you ask in research, ideally followed by an open question to detect the reasons behind the given score. NPS is a standard question type in the CheckMarket survey tool, which has the advantage that you automatically see the calculated NPS score in your reporting.
Ron Hine - February, 2016
We perform surveys after every touch of our customers and NPS scoring is included. Our leadership team has recently been discussing moving to a Yes/Maybe/No answer scheme for the NPS question of would you recommend XX. There is concern that we receive an 8 at times from individuals that they believe are promoters. This has been validated in some of our follow ups to the lower score customers. Some managers feel the Yes/Maybe/No options removes ambiguity. What are your thoughts on this topic?
Gert Van Dessel - February, 2016
Hi Ron,
In my opinion your focus should be on improving your NPS score instead of questioning the methodology. Promotors are very enthousiastic customers who would spontaneously recommend you to other people. If there are not enough promotors for your company, you should think of actions you can take to increase your nr. of promotors (by moving them from passive to promotor) or decreasing your detractors (by moving them from detractor to passive). It is not your absolute NPS score that is most important, but the evolution of this score over time. Certain industries or regions tend to have higher scores than others, but it is not by changing your measuring scale that your companies performance or customer satisfaction will improve.
Charles - February, 2016
Hi Gert-
I really appreciate your diligence and effort to answer everyone’s questions.
I was curious if you could provide any insight on a question we have. We are conducting a survey where the first question is overall NPS, and the next two are “the pros to working here” and “the downsides to working here”. I have read that NPS should always have a “why” option following the question, however we feel that the answer to this question should be addressed in the pros and cons section.
Do you agree? Or do you still feel that we should include a why for NPS results along with the pros/cons.
Thanks, Gert!
Gert Van Dessel - February, 2016
Hi Charles,
I think those 2 questions will mostly cover the reasons behind the NPS score that has been given.
‘Why would you (not) recommend working here?’ will give you some more specific answers, the replies to your questions will go somewhat broader in my opinion.
DB - February, 2016
Gert-
Thank you so much for answering so many questions! I am going to add mine to the mix as well.
We want to include the NPS alongside our other questions in our survey. We are using 5 stars, however we allow the option for half stars as well. We would like to keep consistency with the format of the entire survey.
Here is my question: What do you think about using a 5 star rater with .5 increments for the answer to the NPS question? In our mind: 4.5/5 stars = promotor, 4-4.5 = passive, and 0-3.5 = detractor. Is this a sufficient way to capture the results goal of NPS, or do you see red flags?
Gert Van Dessel - February, 2016
Hi DB,
As long as you don’t want to compare with NPS scores from other companies and are purely interested in the evolution of your own scores, this would be an option.
But your scale only has 10 points, compared to 11 for the NPS. Especially the option to consider 3.5 as a detractor score, seems a bit odd to me. In my mindset a 3.5/5 is associated with a 7/10 score, which in the NPS framework is considered as a passive.
DB - February, 2016
My apologies, Gert. I meant to type 4.5-5 promotor, 3.5-4 passive, 0-3 detractor. If we include 0 as an option, wouldn’t that account for all eleven possibilities?
My last question – do you see any potential issues like the following example: The user rates 4/5 because they think that 4/5 is a good score (due to being used to rating 5 star sites), but technically by NPS measurements that is an 8 and considered passive? My thought is that we need to emphasize that 4.5 is an option, but do you think that that is enough?
Gert Van Dessel - February, 2016
That will be a better approximation of the NPS question. However, interpretation of the star rating can be different for a lot of respondents compared to the 0-10 scale. If you want to call it an NPS score, I would stick to the original 0-10 scale to avoid any criticism/discussions afterwards. I don’t see any advantage in using the star rating, besides that it might be more appealing to fill in.
DB - February, 2016
Hi Gert-
So are you saying that It would not be appropriate to conduct NPS with 0-5 and .5 increments? Or is it simply the star rating aspect that raises your concerns?
Gert Van Dessel - February, 2016
DB,
I am not saying you cannot use this scale, or that your results will be very different from the score obtained with the original NPS scale, but NPS is a standardised method; and if you want to compare with other NPS scores, I would personally stick to the uniform way of working as it was developed by Fred Reichheld and used by the large majority of researchers
Dave - February, 2016
Hi Gert,
Great stuff. Quick question – Can NPS be used to evaluate an individual? For example: “How likely are you to recommend John Smith to a friend?”
I am thinking in context of evaluating a boss/coach/teacher etc…
Thanks!
Gert Van Dessel - February, 2016
Hi Dave,
This is a possibility, but you must be sure to have enough responses to have a reliable score. It is also important to be clear about the context.
You could rephrase the question for example as follows: How likely are you to recommend John Smith to a friend as a teacher.
A person can be great as a friend or entertainer, but not necessarily as a teacher, and this is the skill you are interested in.
Of course, there are a lot of other questions that can be used in an evaluation process. In our tool you can check out a survey template with example questions for a 360° evaluation.
Dave - February, 2016
Thank you, this makes sense! What do you think about using NPS vs a simple approval rating? For example: do you approve of your teacher/coach/boss – yes/indifferent/no.
Gert Van Dessel - February, 2016
Dave,
According to me the NPS 0-10 point scale gives the the opportunity to add more nuance.
Someone who replies ‘yes’ to the approval rating question could have given a 7 score in the NPS question but also a 10. As you will agree, this implies a totally different evaluation of the person in question.
Dave - February, 2016
Thanks! Are there any issues with standard practice of having 2 NPS questions?
1. How likely are you to recommend organization to friend
2. How likely are you to recommend individual to a friend as a teacher
Gert Van Dessel - February, 2016
Hi Dave,
I don’t see any problem with that.
Babette - December, 2015
Hi Gert,
I have a question.
At the moment I am writing my thesis.
In my survey I also involved a question to get the Net Promoter score. The only thing is that I later on discovered (after getting al the results back) that I only included 1 through 10 and not the zero.
Can I still use the net promoter score in my thesis with these results. Or at least an indication of the outcome?
Many thanks in advance.
Gert Van Dessel - December, 2015
Babette,
I don’t think this will have an influence on the score you get (or a very minor one). A respondent that would have selected a zero score will not suddenly become a passive or promoter because that option is missing. I would however indicate in a footnote some explanation about this, because this is not the ‘official’ NPS scale.
Rob - November, 2015
Hi Gert,
I have a question about using NPS in an internal environment eg IT support inside a large corporate.
Plenty of people are keen on using NPS, but I feel the whole premise of asking “would you recommend our services to a friend or colleague?” is somewhat flawed given they dont really have any choice, ie there is no competing IT dept, nor do they pay for each service. So whilst we can compare to our own monthly numbers, comparing for example to Apple or Amazon’s published NPS seems invalid to me.
What do you think?
Thanks
Gert Van Dessel - November, 2015
Rob,
What you have to do in this case is look at the evolution of your own NPS over time. Try to use open questions to detect problems or flaws in your service, develop an action plan to handle these issues, and then look at the impact on your NPS. This is a continuous process and in the long term you should be able to see a significant improvement in your NPS score.
Rob - November, 2015
Perfect, thank you. Compare apples with apples… :)
Aamir Qadri - December, 2016
Our company sends out NPS survey to 7200 customers ever six months. Usually, ~1200 open the email— but only ~300 submit any response… with about half of those including a comment. Is ~25% of our customers opening NPS survey actually submitting answer similar to industry response rates?
Gert Van Dessel - December, 2016
Hi Aamir,
It is difficult to give an ‘average’ response rate for NPS research. This depends on a lot of factors, for instance:
– the bond the customer has with the product (e.g. response rate for a NPS survey about your holiday will probably generate higher response rates than for a survey coming from your insurance company)
– the timing of your survey (e.g. lower response rates during a holiday period)
– familiarness with the name of the sender
– the subject of your e-mail (keep it short, clear and inviting)
– the attractiveness of your e-mail invitation (embedding your NPS question in the e-mail will boost response rates!)
– the length of your survey (keep it short en to the point)
– …
So you will understand is very important to think carefully about all of these criteria and try to optimize the parametres you can influence.
Nikolay - October, 2015
Hello! I’ve got a question, maybe it’s a little bit offtopic, but still very close. We are making at our company (real estate sector) a regular monitoring of client’s opinion: asking them several questions, one of them looks very much like NPS. But we ask also to evaluate the work of our managers on a 10-point scale (0 or 1-worst, 10-best, as usual). At the end of month each manager gets an average point. We have noticed, that the average mark for almost every manager is about 9 points or higher. So it looks really like a very good job. But we have got some doubts now: is it really OK to have such a high “score” for a rather long period of time? Maybe we’re asking the wrong question? Or the people feel some kind of a compassion for the managers and therefore asess them high? Or it’s a feature of Russia’s mentality, to give a high grade?
Please share your opinion, if you have got any experince in the area. Maybe there were some researches on the topic…
Gert Van Dessel - November, 2015
Nikolay,
It is absolutely true that certain cultures tend to give higher scores than other ones, but it is very difficult to determine the regional impact.
It seems like the managers in this study are doing a very good job indeed if they only get 9’s and 10’s. NPS is not the ideal measure to measure manager’s performance, as it was developed as a customer satisfaction index. I would suggest to use a number of different statements about the managers conduct/performance using a 5-point Likert scale (‘totally disagree’ to ‘totally agree’). Or even better a 360° exercise. In our survey tool you can find a template for a 360° evaluation questionnaire. You can register for a free trial to check this out.
anna - October, 2015
Hi Gert,
Can you please send an example how could NPS be introduced as a part of performance evaluation.
Paul - August, 2015
Hi; i work in a telco company doing online survey through phone call (CATI) i would like to know what can we do with respondent who are detractors (5 and 6) but giving promoters reasons and seem to not be unhappy customers. Do we need to exclude those detractors by consider just a scale from 0 – 4 or need to keep them.
Gert Van Dessel - August, 2015
Hi Paul.
Thanks for your question. I would not start messing with the answer scales. When someone gives you a 5 of 6 score, you can not consider this as a happy customer, eventhough his comments are on the positive side (maybe this person is afraid to show any criticism by phone and only gives social desirable answers). The NPS is a standardized index, if you start adjusting scales your comparability with other sectors’ or companies’ NPS scores will be gone. And you have to remember it is not the absolute NPS value that is most important, but the evolution over time (the impact of the actions you undertake to increase NPS).
Kaf - May, 2015
Hi
We are just entering the wonderful world of NPS and initially have 5 different scores for individual depts.
The CEO is looking for one overall NPS score for the company. Reading your comments to date not sure if that makes sense. I had thought of adding the total number of Detractors, Passives and Promoters to obtain an overall score. Sample sizes are different for different depts which would skew this result. Any advice please on how to calculate or if indeed we should calculate one overall score
Gert Van Dessel - May, 2015
Hi Kaf,
Thanks for your question. It does make sense to calculate an overall NPS score for your company.
To do this you have 2 options: you can sum up all individual scores and use the normal NPS calculation (all promoters – all detractors). Or you can calculate separate scores per department and use an average of the department NPS scores. The last option is useful when the nr. of responses per department differ significantly, while each department is equally important.
When you want to attribute different levels of importance to the departments, you can use a weighted average of the departments NPS scores.
Kaf - May, 2015
Thanks Gert
Ferjo Fereja - May, 2015
How do I interpret NPS result say for example if the result is -25%,45% and 75%?
Thank you in advance.
Gert Van Dessel - May, 2015
Generally speaking I would say you have to strive for a positive NPS score. 75 can be considered as an extremely good score, 45 is also still very good, -25 is rather poor. But even more important is the evolution you can see in the score over time.
It is beter to go from NPS = 30 to 40 then when you have a situation where your NPS score drops from 50 to 40.
Ritesh - April, 2015
Hi Gert,
Why cant NPS be calculated on a scale of 1 to 5. 1,2,3 being detractors, 4 being passive and 5 being promoter. Is this calculation not accepted globally.
Gert Van Dessel - April, 2015
Ritesh,
NSP is a globally standardized index which uses a 0-10 measurement scale. If you want to benchmarks with other NPS scores (in other countries or sectors), you will have to use this scale. The 0-5 scale will be an approximation, but is not quite te same
Ritesh - April, 2015
Thanks Gert
Sara - April, 2015
We have been utilizing the NPS Survey in our company for the last 6 years. From the beginning it has been offered 100% via live agent O/B call without a mix of IVR or email responses. The responses are then documented by the agent, agent selects categorizations based on the topic mentioned as it aligns to whether it was a satisfaction driver or dissatisfaction driver, and then an NPS score is calculated for each process/operation mentioned to cause sat/dissat.
Now we are considering transitioning all or part of the NPS survey collection to Email method to save headcount and to increase response volume. My concern, before doing so, is whether this transition has been proven to 1) Add greater benefit by the elimination of agent subjectivity when categorizing, and 2) Is live phone agent discussion the best way to delve deeper into the root cause of the sat/dissat, and thus should be maintained if possible.
What delivery methods do the majority of top companies utilize when conducting NPS Surveys?
Thanks
Gert Van Dessel - April, 2015
Hello Sara,
Thanks for your question.
The benefit of phone interviews is that you can dig deeper in details and ask for explanation if anything is not clear. On the other hand, our own experience has learned that respondents tend to be more honest in online questionnaires, which results in lower NPS scores (difference of 10 or more index points). When talking to someone by phone respondents feel a certain barrier for expressing criticism (this is called satisficing effect). And as you point out, there is also some subjectivity when you have to depend on the agents to make the categorization. You can use both methods, but have to be careful with historical comparisons when you shift from one to another.
Barry Parr - April, 2015
Good suggestions. The simplicity of NPS is the key to its success, and also why you should consider it. It’s easy to overthink customer satisfaction. The NPS methodology makes that hard to do, so you can focus on your product and service and not your methodology.
The lack of benchmarks by industry is frustrating. It’s hard to get good data without paying a consultant.
We took the NPS methodology a step further, by linking our responses to customer behavior. We found out some interesting things about our customers, including that those customers who asked for the most help were some of our best customers.
Gert Van Dessel - April, 2015
Hi Barry,
Great article with some valuable insights. Benchmark data are hard to find indeed.
We also have the impression that people who frequently contact our support department are amongst our most happy customers (which can be considered as a compliment for our support colleagues…)
George - February, 2015
Can we use nps for departments as opposed to the e tire organization? I lead the service department at our organization and want to know specifically of the client would recommend the service department since we have another survey sent for the entire organization.
Nicolas - January, 2015
Hello, what are the fundamental differences between NPS and Customer Satisfaction Index (CSI) ?.
Thanks
Krish - January, 2015
Hi Nicolas,
First of all both NPS and CSI are measures of customer experience. NPS is a measure of advocacy which links to the survey question “who likely you are to recommend XXX on a scale of 0-10”
A CSI score is a measure of satisfaction which links to the survey question “how satisfied are you with XXX”
The argument for NPS is usually that it relates to the customer’s propensity to churn or increase product holdings. Whereas it a customer is satisfied with your product or service, it wouldn’t necessarily stop the customer from considering an alternative provider or encourage the customer to sign up for new products.
However, in my opinion, both have merits in their own right when used in the appropriate context. For example asking a customer whether they’d recommend you on the back of a non-defining moment or transaction (e.g.provided me my acct balance ) wouldn’t make sense.
On the other hands there are some aspects of your product or service that you’d expect the customers to always be satisfied with. If there are not it is likely to be a churn trigger. This is where CSAT might be more appropriate as a measure
Jackson - January, 2015
When presenting the question in a survey to a customer is it against the methodology to publish the likert scale? For example: Adding Color Coding. 1-6 in Red, 7-8 in Yellow, 9-10 in Green. So that customers know what is green, yellow or red?
Gert Van Dessel - January, 2015
Jackson,
We strongly recommend not to add color coding to the answer scale, as this will lead to bias in your NPS score. We have done some tests in the past, and we noticed that the NPS was considerably higher when using this color coding compared to the ‘standard’ NPS (about +10). People tend to give more scores in the ‘green’ area’. Which is of course great if you want to have a good NPS score for your company, but not really honest when comparing your score with the NPS of your competitors.
Anja - December, 2014
Hello,
we would like to start up a NPS research for our B2B partners (retailers, distributors, installers), but we are struggling with the way to ask the NPS question. For your information: We would ask the question to the person who places the orders (buyer).
We are considering several options: How likely are you to recommend to “????”
– if we put ‘other distributors’ , the reaction can be that they don’t want to recommend the brand because they don’t want that other distributors sell our brand
– if we put ‘others’, than they might think that we mean “endconsumers”. But we want a more general view, not only on product, pricing etc. but also on service provided by us as company.
– If we put ‘colleagues’ or ‘friends’, I’m afraid it will be too difficult to comprehend what we mean considering the target group (that they don’t understand why we are asking this)
We want to capture the total brand perception (so price, service, product, etc.). What is the best way to ask the question without confusing our partners?
Thanks for your help,
Anja
Gert Van Dessel - December, 2014
Hi Anja,
What do you think about ‘other colleagues in the sector’. I think that would cover it. If necessary you can add ‘(retailers, distributors, installers)’ between brackets.
So: “How likely are you to recommend [YOUR COMPANY] to other colleagues in the sector (retailers, distributors, installers)?”
Marina - December, 2014
Hello,
In my company we have been using NPS for some years now. I fully agree with your article, although it is very useful there are some critical points like not taking into account “passive” (answers from 7 to 8). Do you know if there is any study or article about cultural influence on NPS. I explain myself. In Europe, there are a big difference in giving a score (starting from school): in latine countries it is very difficult to give a 9 or a 10 (at school impossible) because it means perfection, and it is more usual to give a 6 or a 7 which does not mean you are not satisfied or passive. In northern Europe when you are satisfied it is normal to give 9 or 10. Therefore, comparing countries is difficult and scores are not as good in southern europe countries / latine countries. Is there any study on this?
Thanks a lot in advance!
Gert Van Dessel - December, 2014
Hi Marina,
The issue of cultural differences influencing NPS score has already lead to lots of discussion. One of our own articles talks about the need for an adjusted NPS-EU score for Europe:
https://www.checkmarket.com/2012/01/we-need-an-nps-eu/
Another interesting blog about the ‘Dutch’ effect on NPS:
http://customergauge.com/news/net-promoter-is-there-a-dutch-effect/
And a discussion on the NPS forum about the same subject: http://www.netpromoter.com/community/net-promoter-forum/alldiscussions/viewthread/?GroupId=25&MID=4267
What we learn from all this, is that there obviously are differences between regions, sector, etc., there’s not much we can do about this.
Our advice is not to worry too much about benchmarks. More important is the evolution of your own NPS score. Start tracking it over time, use key-driver analysis to find out which factors influence your score. Ask your respondents to explain their score to gain valuable insights. And try to improve your NPS period after period, setting up clear objectives.
Pery - October, 2014
Thanks for your efforts in this blog. Great info.
We’re in the process of implementing NPS to our internal customer base. Our current plan is to send the survey to 1/12th of our customer base each month, so each customer would have a chance to participate once per year. In the scenario, would you suggest that our NPS be reported as the “rolling average” vs. the current months results?
Gert Van Dessel - November, 2014
Hi Pery,
Thanks for the compliment.
Great idea to send out the survey to 1/12th of your customer base, this will avoiud survey fatigue.
I agree you can use the current months’ results and the 12m moving average for the reporting.
Current month fort the short term follow-up, and your 12m average contains the responses for all of your customers then.
Amber - October, 2014
I need to know the formula which shows how many positive surveys are required to achieve the NPS target of 62% you can use this data for an example : NPS: 48% , Detractors: 17.07%, Neutrals: 17.07%, Promoters : 65.85%. Number of surveys : 0-6
=7, 7 to 8= 7, 9 to 10= 27.
Gert Van Dessel - November, 2014
Hi Amber,
First of all sorry for my late reply…
I’ve taken a look into this, and here’s my calculation based on your example (promoters = P, passives = N, detractors = D).
NPS = 62% = (P-D)/(P+N+D)
> P-D = 0,62P + 0,62N + 0,62D
> P-0,62P = 0,62N + 0,62D + D
> 0,38P = 0,62N + 1,62D
> P = (0,62N + 1,62D)/0,38
For your example (D=7 and N=7) this means:
P = (0,62*7 + 1,62*7)/0,38 = 41
So with 7 detractors and 7 passives you will need 41 promoters to get a NPS of 62.
Mel - September, 2014
Hi Gert,
Great article and advice you have provided.
We have an NPS project where we get completely different scores across different countries. There is discussion about adjusting for cultural differences. i.e. Some people believe that the differences in scores is due to people in different countries respond differently to the 0-11 scale, rather than a real difference in their likelihood to recommend. I don’t think making adjustments is a good idea – are we really adjusting for cultural differences or are we compensating for poor CSat?
I would love to hear your opinion.
Joyce - September, 2014
Hi,
We have a business that has different Touch Points and customer responses would pertain to different departments from time to time as their negative experience had more impact than their current experience.
I have gotten requests to change touch points score because it is not their issue.
Currently we do not change scores as we believe issues no matter where t came from is a business issue.
Should we be changing scores and recalculating results if the issues does not belong to that touch point?
Looking forward to your clarification.
Gert Van Dessel - September, 2014
Hi Joyce, thanks for your question.
I understand your problem, but I would’t start manipulating scores, as this will open the door to randomness and criticism. There is no point in departments telling ‘we got a bad score, but is was not our fault’.
Although based on specific touchpoints experiences, your customer will have a global opinion about your company or service.
The real value of your survey lies in the open comments given by the respondents explaining the NPS score and reason for their satisfaction/dissatisfaction.
Based on this you can take appropriate actions targeted towards the different Touch Points.
Joyce - September, 2014
Hi Gert,
Thank you so much. We have started educating each touch point to focus on improving what they can control based on customer feedbacks and hope to see better customer experience.
Have a great day!
Gert Van Dessel - September, 2014
You’re welcome Joyce. Good luck with your NPS journey!
Jessica - September, 2014
Hi Gert,
Great article. I have two questions for you.
#1 Would you recommend sending out an NPS with simply two questions: (1. how likely is it that you would recommend… and 2. to help us continue to improve our product, please explain why) or is it best to include more?
#2 How many respondents is needed to get a true representation of NPS? We have a number of different products, each with a separate post purchase NPS survey sent 1 day following purchase. We collect and download results monthly. Some have as few as 40 and some as high as 1000 respondents in a month. We have very low (-) results and want to find out how best to improve our score.
Thank you.
Gert Van Dessel - September, 2014
Hi Jessica, thanks for the compliment.
It is certainly a possibility to only use 2 questions (NPS + follow up question) in your NPS survey, especially when you have difficulties collecting enough responses (the shorter the survey the higher your response rate.
You could however differentiate in your formulation of the follow-up question for promotors, detractors and passives. E.g. the formulation for promoters could be ‘Great to hear you give us such a good score! What can we do to even further increase your satisfaction?’ and for detractors ‘Sorry to hear you only give us a 4 out of 10. Why are you disappointed in our product and what improvements can we make?’
In our survey tool you can use branching to show the relevant question based on the NPS score and you can use ‘piping’ to include the given score in the follow-up question. Another option would be to send alerts (e.g. a mail to the account manager) for each detractor respondent so he/she can be contacted (for more information see our article about the 4 stages of NPS: https://www.checkmarket.com/2014/06/4-stages-of-net-promoter-score/
For the sample size we recommend a minimum of 100 respondents for each product or service you want to measure. Of course when you are dealing with a group that isn’t very large (e.g only 50 key customers) you can still get reasonable feedback if 70-80% of them answer the survey.
Stephen - August, 2014
Do you think it would be fair to link an advisors NPS to a bonus. I think NPS is a fantastic tool for a company to measure success of both the agents and the customer service they offer but do you feel that someones personal interpretation on a limited number of NPS feedbacks linked to a bonus could be seen as unfair? Your views would be appreciated.
Gert Van Dessel - September, 2014
Hi Stephen,
Sorry for the late reply due to to holiday. I do know of some (large) companies using NPS as a parameter for bonus calculation. However I do agree that the number of respondents you use to calculate the score has to be large enough in order to be statistically significant. I would go for at least 100 respondents for each reviewee.
Aneet - August, 2014
apologies .. pls read that as Gert,
Aneet - August, 2014
Hi Greta,
Why is 0-10 scale used for NPS ? why not a 1-10 ?
Many Thanks
Gert Van Dessel - September, 2014
Hi Aneet,
That’s a question you will have to ask Satmetrix, the original developer of NPS. The 0-10 scale is is the widely spread standard that is used in all regions and industries. A reason could be that the 0-10 scale has a ‘neutral’ midpoint 5 (with 5 better and 5 worse scores) but that’s pure speculation from my side.
saurabh - August, 2014
if we are using 0-5 scale
what will be detractor/passive range
Gert Van Dessel - August, 2014
If you wnat to calculate a NPS score you will have to use the 0-10 answer scale, otherwise it’s no NPS index.
Also for benchmarking purposes I recomment to stick to the 0-10 scale.
If for some reason you are obliged to use the 0-5 scale, I would go for 5 = promoter, 3-4 = passive and 0-2 = detractor. But don’t call it an NPS index then.
Zacharia Burton - August, 2014
Hi Gert,
What would you say should be the NPS target for a disconnections department in the telecommunications sector?
Gert Van Dessel - August, 2014
Zacharia,
I cannot help you with specific target scores, as this is very specific per sector and region. It is best to start with your own zero measurement, and based on that set a target for the next measurement period.
Christian - July, 2014
Hi Gert, Thank you for the blog and all your effort responding to questions. My company is considering implementing NPS, but our contact center mainly supports our indirect sales channels; namely partner and OEMs. Therefore, I think the “would recommend” question would be a bit awkward as our partners friends and family would simply never use our services. Do you have any experience in such an indirect B2B environment? Would a simple rephrasing of the questions such as “How satisfied were you with our services” have the same interpretative effect?
Thanks again!
Christian
Gert Van Dessel - July, 2014
Hi Christian,
The ‘would recommend’ part is inherent to the NPS questions, if you leave that out you won’t be measuring NPS anymore. When you recommmend a service to some of your a acquaintances you put your own reputation at risk, which goes a step further than simple satisfaction. Maybe you can replace friends/family by ‘other manufacturers/potential partners?
Mpho - July, 2014
Awesome article Gert, our company is introducing NPS in our department stores but we are grappling with the best way to distribute the survey to customers. We have printed cards with the NPS question, a scoring from 0 to ten and fields for additional comments. We want to conduct transactional NPS but the main challenge is where to hand the customer the card during their shopping journey; at the door, while they are shopping, at the till point etc. Please advise
Gert Van Dessel - July, 2014
Hi Mpho,
As you want to measure the shopping experience as a whole, I would hand out the NPS cards when your customers have finished their shopping journey, which means at the till point after they have paid.
When you give them the cards before or during the shopping, this could create some bias, as your customers are aware they have to make an evaluation and may become more critical are more aware of details they wouldn’t notice otherwise.
Alanna - June, 2014
Hi Gert,
My company has recently started using NPS, however the scale is from 1-10, not 0-10. The question is also optional, so if a customer does not fill in the score, then it counts as a zero in our system, which we are then excluding from the sample size. I just have a couple of questions I was hoping you could help me with:
(a) What is the impact of only using a 10 point scale instead of the 11 point scale?
(b) Should we be including the zero scores (non respondents) as detractors?
Thanks
Gert Van Dessel - June, 2014
Hello Alanna,
If you have just started measuring NPS a couple of weeks ago, I would consider changing the scale to 0-10. The impact will probably be marginal, but it is better to start on a correct base, especially when you want to benchmark with other NPS scores.
The non-respondents cannot automatically be considered as detractors, so don’t include them in your calculations.
Sandra - June, 2014
HI Gert,
Quick question: where would you recommend to position the NPS question in a surveys (when the survey is made of several questions, out of which the NPS one): as the first question or rather at the end of the surveys?
Gert Van Dessel - June, 2014
Hi Sandra,
Both options have pro’s and con’s.
If you ask the question at the beginning of the survey, you will get a higher number of people responding to that question, but only a “top of mind” answer. If you ask at the end, you may get fewer responses, but the responses you do get will be more thought out after the respondent gets more context as they answer all the other survey questions.
If the questionnaire is not too long and you are confident that you will get enough fully completed surveys, I would put it at the end (followed by an open question to explain the score).
Parth Kochhar - May, 2014
Which other tools can be used for measuring cutomer satisfaction?
Gert Van Dessel - May, 2014
Parth,
The internet is full of interesting customer satisfaction measurement techniques and tools. One concept that is showing up a lot lately is the co-called Customer Effort Score (often in comparison with NPS).
This score is based on the question:
“How much effort did you personally have to put forth to [insert interaction here, e.g., get this issue resolved]?”
The 5-point answer scale goes from ‘Far less than I expected’ to ‘Far more than I expected’
An introduction to the topic can be found in following article:
http://www.cx-journey.com/2012/06/whats-your-customer-effort-score.html
However the NPS remain, in my opinion, one of the most useful, intuitive and easy to interpret customer satisfaction indexes.
Parth Kochhar - May, 2014
Which other tools can be used to measure customer satisfaction ?
Efthymios - May, 2014
Can we use the NPS for measuring the performance or the inluence of the job of an employee/executive e.g. ask customers to evaluate the question: “Do you think that the support u get from John is satisfactory?” from 0-10?? Would that be right??
Gert Van Dessel - May, 2014
Efthymios,
You can use NPS for this, but then you would have to reformulate your question as follows:
How likely are you to recomment ‘John’ as a support contact person to your friends or family.
If you use this formulation, you can perfectly calculate the NPS score
Tom Vivian - April, 2014
I am looking for information on how many surveys we need to do in order to achieve a statistically accurate sample in NPS surveys. I find this answer easy to come by on typical CSI surveys (where customers are divided into only two groups), but much harder on NPS surveys where customers are divided into three groups. I am looking for results with no less than this level of accuracy: 3% margin of error with 95% confidence rate in the results. We use NPS to track our customer ratings for our own company which is large and serves millions of customers. However, my job in vendor management is to track much smaller vendors, that may service as few as 100 or as many as 1000 customers per year. I am trying to figure out how many customers I need to have surveyed in order to achieve the kind of statistical accuracy I am looking for. Any ideas for a simple way to calculate what I need?
Didier Dierckx - May, 2014
Hi Tom,
That is a very interesting question.
As you know, in more traditional market research, the conventional minimum is approximately 300 respondents per segment.
However, the NPS score is based on proportions. As a result your MoE will be dependent on the distribution between the promoters/passives/detractors. For instance, a situation in which the majority of respondents is a promoter, the margin of error will be lower than when the distribution is more evenly spread. That is why I would not be aiming for a fixed amount of respondents for each segment (i.e. promoter, passive, detractor).
You can always calculate the MoE afterwards using the formula’s below:
VAR NPS = [(1-NPS)² x proportion promoters] + [(0-NPS)² x proportion passives] + [(-1-NPS)² x proportion detractors]
MoE = (VAR NPS/√n)
I hope this helps.
Didier
V Broman - April, 2014
When a caller is answering the NPS question(s) through the phone (IVR), the 11 point scale can be a bit tricky if the caller input a 1-0 slowly. It can be taken as a detractor (1) rather than as a promoter (10). To ask if the caller meant to enter a 1 rather than a 10 could be considered leading the caller. If the options were reduced to a 0-9 score, what impact would that have on the overall NPS scoring?
Gert Van Dessel - April, 2014
I would try to focus on solving the technical telephone problem. If you use the 0-9 scale, you won’t be able to benchmark your NPS results with other NPS scores.
Your NPS will probably be higher compared to the ‘standard’ NPS if you use 8-9 for promoters and 0-5 for detractors (people are intuitively more likely to give a 8-9 score than a 9-10 score). The only comparison you can make with this adapted NPS is with your own historical data.
Itumeleng Maimela - April, 2014
How do you calculate an acceptable sample for your customer feedback CSat: ( if your call center answered 1239682 calls and per agent 830 calls answered however the overal Rating from customer is 2923 and Csat is 91.71%. Is this a true reflection of our customers satisfaction? what would be the acceptable sample as per industry?
Anna - March, 2014
How often per year should you send out a NPS survey?
And once you get the results, should you focus on the passives or the detractors?
Gert Van Dessel - March, 2014
Anna,
If your client base is big enough, the best option would be continuous tracking, a lot of our clients do this. You can ask the NPS question after certain types of interaction, e.g. when a customer orders one of your products. This way you can immediately follow up dissatisfied clients. With the notifications function in our survey tool you can trigger automatic follow up actions (e.g. send an e-mail to the responsible account manager). In this way you can take action to convert your distractors into passives.
However you shouldn’t neglect the other two groups neither. Try turning your passives into promoters and keep your current promoters happy to avoid them dropping back to the passives group.
Gemma - April, 2014
Hello,
We want to continually track our NPS and ask at various parts of the customer journey.
I am confused by a couple of things : –
1. Can I generate a NPS for different parts of the business? ie one for client support, one for production etc. Then do one for the company as a whole?
2. Is it running data? So if I report back on a monthly basis, if someone gave us a 2 in February is that still counted in the results in September? Does that make sense? Or do I start from a clean slate?
Thanks
Gert Van Dessel - April, 2014
Gemma,
For Q1:
If your respondent base is large enough you can calculate NPS for different parts of your business. It’s best to focus on the evolution of the separate NPS scores per department or service rather than to compare them. E.g. your customer complaints department will probably get lower NPS scores because they have to deal with unsatisfied customers, but it(s the evolution that counts.
For Q2:
Again if your respondent base is large enough you can track month by month for the short term follow-up, and on long term you can use year by year NPS scores
Frits - January, 2014
What to do with rounding NPS in graphs?
We are calculating an NPS and had the following results:
Promoters: 83 (which is 58,45 %)
Passives: 12 (which is 8,45%)
Detractors: 47 (which is 33,08%)
We show these results in a graph that runs up to 100% and shows figures without comma’s. This means the graph shows:
Promotors: 59%
Passives: 8%
Detractors: 33%
The graph would than show a positive NPS of 25, but calculated on the original results it would present a NPS of 26.
To calculate the NPS are the actual percentages used or do you use the percentages which are presented after rounding on a 100% scale?
Olie - January, 2014
Thanks for the great article. We’ve used NPS for a while now. I’ve been asked why passive scores are relatively high (7 and 8). My thoughts are that NPS could be though of as a scale between -10 and 10 (-10 being likely to warn people away) but then concentrated into a smaller 11 point scale for ease of use. This would mean that a score of 0 is actually someone who is really annoyed and will warn others not to join, a score of 6 is half way and is not annoyed but would not recommend (hence being a ‘detractor’) and 7 and 8 would translate into 6, 5, 4 or 3 on the 21 point scale and make more sense as a passive score. Do you think this is a fair description of why the top end categories are much smaller?
Gert Van Dessel - February, 2014
Olie,
This is an original argumentation, but the easier explanation according to me is that a promotor is someone who is willing to convinve others to use your product or service. If a person gives you a 7 or 8 quote, this means he/she is (fairly) satisfied, but not necessary enthousiatic enough to promote you to his friends or relatives. If someone is giving a 0 to 6 score however this means he/she is not (really) satisfied, and as a result a possible risk for bad word-of-mouth
Jagan - January, 2014
We are a B2B company that has many users from a company using our service. So when multiple users from a company respond to a survey, we average their rating and then use that to calculate our overall NPS. Like five users from a company might have scored us a 9,9,7,6,5, so the average for that company is 7 and we drop that company from our calculations.
Do you think this is a right way to calculate NPS, or should we use the entire user responses for our calculation?
Gert - January, 2014
Jagan,
I would not drop an entire comany based on an average score. An average can hide a lot of heterogenious scores (e.g. 7+7+7 gives the same average as 1+10+10, but the story behind is totally different). My advice is to use the individual scores. For historical benchmark purposes, you can also still keep the ‘company level’ NPS
Sathya - January, 2014
Hi
Nice article.. Is it better to use (no) (may be) (yes) for the question, instead of number scale between 0 .. 10
what are your thoughts.
Gert - January, 2014
Sathya, the NPS question is a worldwide standardized question type, with use of the 0-10 number scale. For benchmark purposed I advise to stick with the defined methodology
Lucy - December, 2013
Good afternoon
We have a business that is consultation based, ie not e commerce. When is the best time to catch them ie via email or text. We are after a good response rate. Do you have any data to support that text or email is better.
Thank Lucy
Sam Van der Veken - December, 2013
Hello Lucy,
There is no conclusive time to send your emails. The best tip is to consider your audience in your email marketing.
Optimal launch times are also subjective to the device the recipient is using. Desktop and smartphone users are most active between 3 and 4pm and are more likely to open emails during business hours. Tablet users are most active from 8 to 9pm and are more likely to open emails outside business hours.
Overall, it’s safe to say your audience is more likely to open your email after 12pm. The most active hours overall are from 2 to 5pm.
Text messages (SMS) have an impressive open rate of 98%, with an average response time of 90 seconds.
Start doing some simple email and text split tests and see which times and which medium your recipients respond to best.
jhoey - October, 2013
hi gert,
im a reporting analyst and i just want to know the best formula for nps%togoal. for example:
target = 45
survey scans = 100
promoter = 34
detractors = 18
passive = 10
thanks for your help.
Gert - November, 2013
Hello Jhoey,
The NPS in your example is 16 (34-18). If the target is 45, you are 29 NPS ‘points’ from this target. As the NPS range is from -100 to +100 I would say the % to goal would be 29/200 = 14,5%, but I recommend to work with absolute NPS numbers.
Kumar - April, 2015
Dear Gert,
Thanks for such an informative article. Reading this, I’m however unclear as to what should or what level of analysis should be done with the Passive customers, because, I believe simply ignoring such a vast % of survey respondents is not justified. They are the most vulnerable of the entire set, and hence there should be some mechanism to grade or rank them and some level of analysis could be done to arrive at a more refined NPS.
Gert Van Dessel - April, 2015
Hi Kumar,
I agree you shouldn’t ignore your passive customers. They are not included in the actual calculation of your NPS, but nevertheless they can have a major influence. The easiest way to increase your NPS score, is to turn your passives into promoters. This group just needs that little bit of extra service and effort to make them genuine promoters of your company or brand.
Alex - October, 2013
The NPS is based on flawed mathematics and flawed questioning. I don’t think it gives useful information – http://badanalysis.wordpress.com/2013/10/14/should-you-use-net-promoter-scores/
Gert - October, 2013
Alex,
I agree in all it’s simplicity the NPS doesn’t show all the nuances behind consumer satisfaction and that is one of the greatest flaws of this index. On the other hand this simplicity is also the strength of the NPS score, the one number gives you a first indication of your companies performance and as it is widely spread between industries you have lots of benchmarks. An evolution over time of the NPS for your company in my opinion still is a very usefull indicator of the direction your company is going. But as it is the case with every number, you have to look behind the mathematics and try to detect what’s behind it to take appropriate actions.
Gabriela Merino A. - September, 2013
Good afternoon:
I have some questions. Is helpful to explain to the interviewee what is being detractor, passive and promoter? What are the number ranges? and in our case, how can we analyze the drivers of the service identified?
Thank you very much.
Regards!
Gert Van Dessel - September, 2013
Gabriela,
I would certainly not explain the interviewee which score makes them a detractor, passive or promoter, as this will influence the NPS score and make this not comparable to other NPS scores.
The ranges are 0-6 for detractor, 7-8 for passive and 9-10 for promoter.
If you want to know the drivers for the score, you can add an open question following the NPS question where you as for a motivation of the given score.
NKM - August, 2013
Can the NPS method also be used to calculate agent level CSAT scores? My current company does that, but in some other companies I have seen agent level CSAT being calculated as an average score of all their surveys.
Gert Van Dessel - September, 2013
Many large companies do use NPS as a major (or the only) indication of customer satisfaction scores for their agents, others can of course calculate the CSAT based on a combination of questions, inclusing NPS or not.
Gert Van Dessel - July, 2013
Yes, NPS can be negative, it varies between -100 and +100
Sandip - July, 2013
Can NPS come in negative ?
In my case it’s coming .
N my data is given below ,
P: Promoter (11.89 %)
N: Passive (40 %)
D: Detractor (48.10 %)
Hello , my data is this now how to calculate NPS.
To Mr. Gert Van Dessel
Consuelo Gutierrez - July, 2013
Thanks Chris!
I have one more question. We also use the NPS for internal ratings of departments by fellow employees, it looks to me that many people give a score of 5 or even 6 when they don’t have anything particularly bad to say or when they don’t have any interaction with a particular dept. I’m going to assume these are passives rather than detractors. Would this be a fair assessment?
Gert Van Dessel - July, 2013
Consuelo,
I would be very careful about giving your own interpretation to the answer scales and changing the intervals. Just stick to the standard calculation and track the NPS scores over time to see what the trend is.
Chris - July, 2013
Great article,
If we have been using the standard 10 pt Likert scale without zero for likelihood to recommend, do you think that our NPS results will be problematic? From a trending perspective, I believe it is the same result – movement in the metric will be the same as if the scale included 0.
Gert Van Dessel - July, 2013
Chris,
As you have less detractor answer categories, you should expect the NPS score to increase. But in this case the impact this will only be marginal (if any at all). Someone who wants to give 0 score will now give a 1 score, which will make no difference in the end for the calculation. It is however important to continue with the same scale for the trending.
Consuelo Gutierrez - July, 2013
Thanks for answering questions about NPS! I am wondering about errors with the Likert Scale. For example, a customer gives the highest marks on all questions in the survey but then at the end gives a score of ‘0’ for likelihood of recommending to a friend/relative. Could this be a mistake? If so, would I still count it as a ‘0’ no matter what?
Gert Van Dessel - July, 2013
Consuelo,
If you think this is not correct based on the other answers I would leave this one out or consider the respondent as a ‘passive’.
Neeth - July, 2013
Hi, Very nice article explaning NPS in detail.. I just have two questions:
1) What is the minimum percentage of samples required to be taken for an organisation of 150000 customers to get a valid response
2) Does every transaction response NPS transform to the final relationship NPS?
Neeth - July, 2013
I mean will 500-600 samples be sufficient to calculate NPS?
Gert Van Dessel - July, 2013
Hello Neeth,
I would go for a minimum of 500 samples, but I would repeat this on a monthly basis to track the evolution over time. On yearly basis you would then have a very solid base of 6000 responses.
Can you elaborate on your 2nd question, this is not totally clear to me
Sharon Chahal - July, 2013
Hi,
We have just started to use the NPS within my organisation. In addition to 0-10, we offer customers the opportunity to answer “don’t know”. When analysing the results, should customers who answered “don’t know”, be included within the detractors sub-set or excluded from the results altogether?
Thanks
Sharon
Gert Van Dessel - July, 2013
Sharon,
I certainly wouldn’t categorize these respondents as detractors. If you would have to put them in a category I would call them passives. As this would have no impact on the calculation of the NPS score the best solution is to exclude them alltogether.
Max - July, 2013
Hi Gert,
another question re: percentages. Example scenario: you measure NPS at 2 different dates: +10 NPS at one date and +20 at a second date later on.
Would you / could you say:
a- NPS increased by 100%, i.e. it doubled
b- NPS increased by 5% (a 10 point increase on a 200 point scale)
c- NPS increased by 9% (120-110 / 110)
d- NPS increased by 10 NPS “points”
e- none of the above
Thanks for your input.
Gert Van Dessel - July, 2013
Hello Max,
In my opinion option d is the only valid statement you can make about the evolution of the NPS. In the same way you can say an evolution from -5 to +10 is an increase of NPS by 15 points.
Sasha - June, 2013
Hi Gert,
I was wondering when the best time is to ask the NPS question for a services site. Do you ask on the site directly, or afterwards via email? Why is one preferable over the other?
Thanks !
Sasha
Gert Van Dessel - June, 2013
Hi Sasha,
I would do this on the site with a pop-up appearing immediately when your customer leaves the site. This will increase the response rate and you will get more accurate comments this way, when everything is still ‘fresh’ in the memory of your visitor.
Christian Lindeberg - May, 2013
There is an error in your article. Absolute numbers are always positive, which makes the following quote an oxymoron, since it cant be negative.
“The NPS is not expressed as a percentage but as an absolute number lying between -100 and +100.”
Gert Van Dessel - May, 2013
Christian,
Thanks for the remark. We use the expression abolute number in this case to make a distinction with percentage, not in the mathematical sense of absolute value of a number. The term absolute number is also used in forums and blogs on Satmetrix website (developers of the NPS).
Andrew - December, 2016
Also, the formula you show always creates a percentage. You say NPS = % promoters – % detractors. That’s always going to equate to a percentage. I’m not trying to be a jerk here but saying that people incorrectly express their results as a percentage following this formula is misleading. They’re right. The way the formula is described is wrong. If you don’t want NPS expressed as a percentage, simply leave % out of the equation. NPS = ((promoters – detractors)/(promoters + passives + detractors)) x 100.
Gert Van Dessel - December, 2016
Andrew,
Mathematically speaking you are absolutely correct, the difference of 2 percentages is also a percentage.
In some publications the NPS-score is given as a percentage, in others as an absolute index.
But we have chosen to follow the methodology as it is used by Satmetrix and Fred Reichheld, inventors of NPS.
And on their website they state:
Subtracting the percentage of Detractors from the percentage of Promoters yields the Net Promoter Score, which can range from a low of -100 (if every customer is a Detractor) to a high of 100 (if every customer is a Promoter).
Which means they don’t use a percentage nowadays (in past publications they also have used the percentage sign).
But you need to focus on the right things: NPS isn’t about the metric in itself, but what you do with it (which actions do you undertake to improve your company’s NPS).
Regardless whether it is a percentage or not.
Brad P - May, 2013
Ummmm. OK. Well, upon closer inspection, I’ve had a data error. In fact, my results are OPPOSITE what I reported… , in this case the score actually improved over time. I had my data sorted incorrectly over time.
Looking for newer theories.
Eric - June, 2013
I bet the early returns are just statistical noise cause by the small sample. I doubt detractors are distributed as early respondents (unless you had a bunch of referral traffic early in the survey from a site with a higher propensity to refer detractors to you).
Eric - June, 2013
This seems especially true given that–contra your earlier assertion–the scores increased to match previous scores as the sample increased.
Brad P - May, 2013
Hi Josh,
I’m using a “notification bar” on the top of the browser window, typically. In the case that’s puzzling, I left the notification up for only 2.5 hours, yielding over 1500 responses. This is an actively engaged site. The first hour, the results, largely matched previous surveys for the same site. The 2nd hour and a half, the score systematically eroded.
The survey is set to not allow the same user to respond, so if that’s working properly, the annoyance rating shouldn’t be a factor.
My theory is that on a site with high engagement. you get a selection bias early in the survey, as the heaviest users statistically outnumber the casual users in regard to the “random” sampling. Then, over time, I now believe that the more casual users are contributing – users who are not as enthusiastic or heavy users, and therefore reflect a less optimistic view of the site.
Anyone else ever look at the data on a rolling basis over time? Would love other stories here.
Gustaf R - September, 2015
I recently did a survey with 39 000 respondents during a week. And i noticed the behaviour that you are referring to and came to the same conclusion. I was later able to actually prove that by looking at a couple of parameter’s change during time.
Brad P - May, 2013
I have a puzzling scenario that I’m looking for insights on. I’ve been doing NPS for a variety of high-engagement sites, and sampling visitors randomly who visit the site using a notification bar at the top of the home page.
Across my surveying, I have had larger and smaller sample sizes, based on my clients leaving the survey links up longer and shorter times. I got curious about the impact of sample sizes, and wondering what the sweet spot was for sample size. I’ve plotted the “rolling” NPS score – recalculating the score after every new data point, and then plotting across the x-axis.
What surprised me was that after levelling off after several hundred data points, the score then gradually erodes systematically over time in many cases. I would have thought that the score should stabilize further, but in fact, it just slides down.
i have my own theories, but would love to hear yours. Has anyone else looked at rolling NPS over the course of an individual data set?
Josh - May, 2013
Hi Brad,
A lot depends on how you ask and where. I’ve noticed more and more NPS questions popping up when visiting a website.
The first time this happens I’m likely to give the site a high score for asking my opinion, but if it asks again on a subsequent visits or many sites I visit have this, I’m likely to give a lower score just out of annoyance.
Also, are you asking “why” and following up, as Rob Markey points out in his comment above?
Bob - April, 2013
Yes I would be happy to have a small bonus on the nps and hopefully I could help to build a good nps for the company but as engineers we will be forced to ask customer to lie and give us good nps to protect our pay and if the customer likes us hopefully they will but this will then lead to a unrealistic nps of the company ,everyone is very angry with this new pay structure and we now feel like it does not matter if we do a ok job and keep the customer happy or if we do an exceptional job as our work quality does not have much impact now its down to nps.i feel sorry for the impact of the customer in the near future ,I hope it does not come to that but I can see it happening ,I’m only a small part in a big company but I always used to feel like I made a difference ,but you are right I do have a minor impact on this score . Nps should be used but not abused
Gert - April, 2013
Hi Bob,
I can understand your employer when he wants to get the whole team involved in improving the NPS and company performance. But obviously you only have a minor impact on this score, so I agree with you that the impact on your salary also should be marginally.
Bob - April, 2013
Hi I work for bskyb eg sky tv , we have now been told our payment now will rely on nps is this normal I am a engineer and I can only control the work I complete so I don’t see how I could be responsible for the entire nps of the customer so eg if the products are poor quality or the menus is hard to use or there is not enough content shown or its to expensive or hard to book a instal or service call for the day or time required or the sales team promises something or withholds information then this is now my problem ,I think it’s very unfair to have my pay rely on this ,I don’t mind kpis or a manager tracking them but wages should not come in to this ,any advise ,thanks
russell - April, 2013
Ok so how do people score -100 is then when they only have detractors or could they score -100 with passives as well. Thanks for your help its much appreciated.
Josh - April, 2013
Hi Russell,
The only way to score -100 would be if 100% of the people who respond to your survey were Detractors. If everyone on the survey were Passives, the final score would be 0 (which would also be true if for every Promoter there was one Detractor).
Josh - April, 2013
If you start out with a negative NPS, Passives will move you closer to 0, but they only way to get positive is to have Promoters.
Example:
2 Promoters, 6 Detractors, 2 Passives.
NPS = 100*(2 – 6) / (2 + 6 + 2) = -4*100/10 = -40
Get 10 more Passives:
NPS = 100*(2-6)/(2+6+12) = -4*100/20 = -20
Then get 10 Promoters:
NPS = 100*(12-6)/(12+6+12) = 6*100/30 = 20
Josh - April, 2013
Hi Russell,
Passives (V) are included and do lower your score, just not as quickly as Detractors (D).
NPS = 100 * (P – D) / (P + D + V)
If you “threw out” those two Passives, you’d have a score of
NPS = 100 * (6-2) / (6 + 2 + 0) = 100 * 4 / 8 = 50
instead of 40.
If your total survey size was 20 and all twenty came back with 10 more passives, your final score would be
NPS = 100 * (6-2) / (6 + 2 + 10) = 100 * 4 / 20 = 20
which is much lower than the 50 you would get if you did not include all of the Passives. Still higher than the negative NPS you would get if those 10 new responses were all Detractors instead of Passives!
russell - April, 2013
I understand how to calculate. Just puzzled that passives are not included yet they are in a way as if you have 10 survey and 6 give you a 9 or 10 and 2 give you 7 or 8 passive then the remaining 2 give you 0-6 your score is 40. Surely if they were passive then they wouldn’t be included at all. Technically they affect your score so how are the passive and not included. To be passive and have no affect those 2 survey would have to be removed completely ?
Gert Van Dessel - March, 2013
Sylvia,
I would recommend to keep the period between the customer interaction and NPS question (or any other survey related to the interaction) as short as possible. Ideally you would have a continuous monitoring system keeping track of NPS on a monthly (or even day-to-day) basis.
With the survey API options in our tool (https://www.checkmarket.com/survey-tool/survey-api) you can even set up automatically sent surveys after each customer contact.
Sylvia - April, 2013
Hello Gert,
Thanks for your reply. For the period between the customer interaction and the NPS question, it makes sense when it relates to a transactional NPS to keep the interaction period as short as possible. But would this still apply for measuring relationship or brand NPS? A relationship NPS would be impacted more by brand-related factors such brand reputation, price, product, quality of the product/service, etc. I’ve seen industry NPS benchmarks (measured by the Temkin Group or Satmetrix) not filter based on based on the interaction period. So just wondering if that is the best practice (not using a filter for the interaction period e.g past 90 days interaction or past 6 months interaction)?
Thank you,
Gert - April, 2013
Sylvia,
I do not know your particular situation, but in any case I would still recommend at least one interaction in the last 6 montht as a minimum prerequisite to have a valid NPS score.
Sylvia - March, 2013
I’ve seen some studies measure the likelihood to recommend questions (or NPS) based on a past 90 day interaction with the company. What is the standard pratice for this question? Should we ensure that our customers have had an interaction with us in the past 90 days to measure our NPS?
Thank you!
Amber - February, 2013
Is it possible to make an equation that works for this? My company uses NPS on an individual level. While individual Salespeople get their NPS “metrics” on a daily basis and have a monthly goal to maintain, getting incentives based on performance. I am trying to make (in Excel), and equation that will say: If you earn X amount of Promoters, you will be at your 54% goal. Given my math – it is flawed as the numbers aren’t really percentages so the math doesn’t work like a percentage. What equation could I use to say: Promoters P, Detractors D, Passive V, Goal NPS 54 . Clearly increasing promoters also increases the total surveys and it is not as simple as promoter + x.
Is there a known way to do that without plugging in extra surveys until my number hits the 54 result? If you have one, I would greatly appreciate it. My math is flawed somewhere. My assumption being that the equation isn’t really a fraction/percentage so won’t act like one in reverse either. I am finding it easier to motivate those below goal to show them how far they are from reaching a number many of them just don’t understand as well as I do. Thanks so much!
Gert Van Dessel - February, 2013
Hi Amber,
Interesting question, I have given this some though but can’t find a straightforward solution for your problem. The NPS can be a result of an endless number of combinations of promotors and detractors, and also your denominator is variable taking into account the passives. In my opinion it is not possible to put this in a simple excel equation.
But if anyone else out there should have a solution for this, feel free to share your thoughts with us!
Josh - February, 2013
Hi Amber,
It is possible to calculate this if you know all of the data, or at least the NPS and the sample size.
NPS = 100 * ( P – D) / T
where T = sample size = P + D + V.
So if we get x new Promoters,
New_NPS = 100 * ( P + x – D) / (T + x)
Goal is to have the New NPS = 54.
after some calculations, ends up as:
x = (T * Goal / 100 – (P – D)) / (1 – Goal/100)
= T/100*(Goal – NPS) / (1 – Goal/100)
Example: 18 Detractors, 72 Promoters, 20 Passive
NPS = 100 * (72 – 18) / 110 = +49.1
x = 110/100 *(54 – 49.1) / (1 – 54/100) = 11.7
So if the next 12 people are Promoters, they’ve exceeded the +54 NPS goal. Of course, each Passive or Detractor makes it harder to hit the Goal.
Having a sample size twice as big will make it twice as hard to hit your goal starting at the same initial NPS. So it would take 24 consecutive Promoters to hit the goal if the initial sample was 220 people and the NPS was still 49.1
This is the type of stat that might be better to look at a monthly basis rather than a daily basis.
Gert Van Dessel - February, 2013
Josh,
This makes sense, thanks for helping us out here!
Josh - February, 2013
It looks like for every 3 new Detractors you need 10 or more new Promoters and for every 5 new Passives you need 6 new Promoters in order to get a NPS of 54.
P:V = Goal / (100 – Goal) = 54/46 = 1.17
P:D = (100 + Goal)/(100 – Goal) = 154/46 = 3.347
Amber - October, 2014
Thank you very much!!!!!
Ingrida - February, 2013
Dear Gert,
thanks for an interesting post! I’m going to start survey on our sites, though I’m not sure how to sample. We have about 250 000 active users on site, so would it be right to totally randomly get 300 answers each month (I suppose I should show survey to about 3000- 3500 users) and next month do same thing but with another random 300 users? Am I thinking right? Thank you very much for your answer!
Ingrida.
Gert Van Dessel - February, 2013
Ingrida,
What you suggest seems a logical way to proceed. I would try to go for 400 respondents per wave to reduce the margin of error to less than 5% (https://www.checkmarket.com/market-research-resources/sample-size-calculator).
If you expect a response rate of 10% you should send out your survey to a sample group of 4000. Make sure to invite a new batch of people each month (don’t send invitations to users who already received one).
After the first month you will have a better view on the response rate and you can adjust the sample size accordingly.
I wish you lots of succes!
Daniela - January, 2013
We conduct Transactional and Relational NPS surveys. We usually conduct Transactional surveys when customers are leaving our stores. But I´d like to know how long after customers have made a purchase (or other transaction) at our stores can we survey them if we want to obtain a Relational NPS?
Gert Van Dessel - January, 2013
It is difficult to set a specific target, because this can differ a lot between industries and countries (some cultures tend to give more positive scores than other). You can search the internet for benchmark scores in comparable countries or sectors. A better solution would be to define bonuses based on the actual evolution of the NPS score compared to a zero measurement you perform at the start of the evaluation period.
col - January, 2013
The company i work for have just introduced nps. what do you consider to be afair target to achieve bonus..
Gert Van Dessel - January, 2013
Interesting question Lou. In my opinion this could indeed lead to some distortion as respondents might try to avoid the Passive answer option (score 7-8). Your NPS index probably will be biased If you want to compare with other NPS scores in the sector, so I therefor would suggest not to share the scoring model with your respondents.
Lou - January, 2013
If you share the scoring model in advance with the customers so that they understand how it works, would this invalidate the results as it could be suggested that you are leading them to the result you wish to get?
Gert Van Dessel - December, 2012
Rob, I totally agree with you on that point. The reasons behind the NPS are equally important (or even more important) than the NPS score itself, and based on this feedback an appropriate action plan has to be developed which leads to an improved NPS.
tareq - December, 2012
thanks there
how many questions to ask?
Gert Van Dessel - December, 2012
You just need to ask the one and only NPS question:
“How likely are you to recommend company/brand/product X
to a friend/colleague/relative?”
Rob Markey - December, 2012
If all you want is to calculate a score, you only need one question, just as Gert points out. But as the creators of the Net Promoter system, we never intended (or recomend) you only ask one question. Rather, you must at minimum also ask the customer why.
The essence of the Net Promoter system is what we at Bain call high-velocity closed-loop feedback, learning and action. The simplicity of the single-question-based score is supplemented by open-ended comments from the customers. All this is delivered straight to people in the organization who can learn from the feedback and act on it.
For a more complete description of the Net Promoter system, including the role of the survey questions, there are many resources at http://netpromotersystem.com.
Gert Van Dessel - December, 2012
Bernie,
Thanks and good luck with the data collection. I would try to go for the same collection method each time to avoid data bias, but if you can extend your respondents sample that’s no problem as this will make your data more accurate.
It’s a good idea to ask for contact details, but don’t use a compulsory question as this could impact the response rate.
If you work with the CheckMarket tool to collect the responses, it is possible to receive automated alerts (via e-mail, an sms text message, Twitter message, …) based on a set of conditions (e.g. only from detractors). On our site you can find more details: https://www.checkmarket.com/survey-tool/automated-alerts.
Bernie - November, 2012
Many thanks. And thanks for such a clear post by the way. I’m eager to give it a try. It will be for a product via a pop up on screen. Can I do it as simply as using the same collection method and same number of respondents each time?
One more question- I assume it’s ok to ask for optional contact details so I can follow up with detractors and maybe promoters?
Gert Van Dessel - November, 2012
I would try to go for 100 respondents, 50 is rather limited as a base to draw any relevant conclusions. As with every sample, the higher it is the the smaller your margin of error will be.
Bernie - November, 2012
Can someone tell me how many responses as a minimum I should use as a base for calculation. I want to compare quarter to quarter and draw the line under a certain number so I compare like number with like number. I have no idea yet how many I’ll get. I’m hoping to use 100 but if I only get 50 is that enough to draw from?
Alstair - November, 2012
What is so special about such a tool? Has it been effectively proven?
Gert Van Dessel - November, 2012
As with many loyalty or satisfaction indexes you always have a group of believers and disbelievers, the NPS is no exception on this rule. However it is a very commonly used index in many industries, which remains popular because it is well marketed, intuitive and easy to understand. You can easily compare your companies score with other benchmarks and track evolution in time. Whether the NPS is an accurate predictor of future growth remains an (interesting) discussion.
Rashmi - October, 2012
why is rating 4 to 1 on a 7 point scale considered dissatisfied
Gert Van Dessel - November, 2012
Some companies use their own variant of the NPS, but for the original 11-point scale NPS the Detractors group scores 0 to 6 and Promoters 9-10. A 4 score on a 7-point scale is more or less comparable with a 6 on the 11-point scale, both in the Detractor group.
Rashmi - October, 2012
I have a query, why is 5 not considered in the NPS calculation
Gert Van Dessel - November, 2012
the 5 score is included in the Detractor group, as this includes scores from 0 to 6
Durga Singh - July, 2012
What are your comments on this PR? http://www.satmetrix.com/company/press-and-news/pr-archive/pr20120314/ where the score is represented in % with 2012 industry benchmark
Vittorio - October, 2012
Seems they made the mistake of copying and pasting a news article without editing the text.
NPS as a percentage makes no mathmatical sense in my opinion. Once you subtract the two percentages the denominator looses its logical value [if you find -4% you should ask youself minus four of what?].
Good discussion though.
Alexander Dobronte - December, 2011
If you are going to use a NPS question in your research, don’t forget to add a reference to Satmetrix. “Net Promoter Score” is a registered trademark! Adding a line as we did at the bottom of this article is sufficient.
Frederico Santos - August, 2011
Hi, I work for a company that constantly presents NPS as a major “weapon”.
The this is that the whole group uses it as a percentage. I’ve seen that several websites use it as a percentage as well… In your situation you say it is not a percentage; what is your comment on that?
Thanks
Gert - August, 2011
Frederico, thanks for your comment.
Both options (with or without %) are commonly used. Wikipedia states explicitly “the NPS is not a percentage but some people wrongly put a % sign after it instead of correctly using “+” or “-” to show the result”.
Although you calculate NPS by subtracting the % of Detractors from the % of Promoters, the result is not itself a percentage, but a (positive or negative) number.
Mayor - October, 2013
What if the NPS is negative, what is the implication?
Gert - November, 2013
A negative NPS means you have more detractors than promotors. Next step is the detection of the underlying problem(s) and setting up an action plan to improve your organisations NPS. You can try to decrease the nr. of detractors, increase your promotors or a combination of both.