
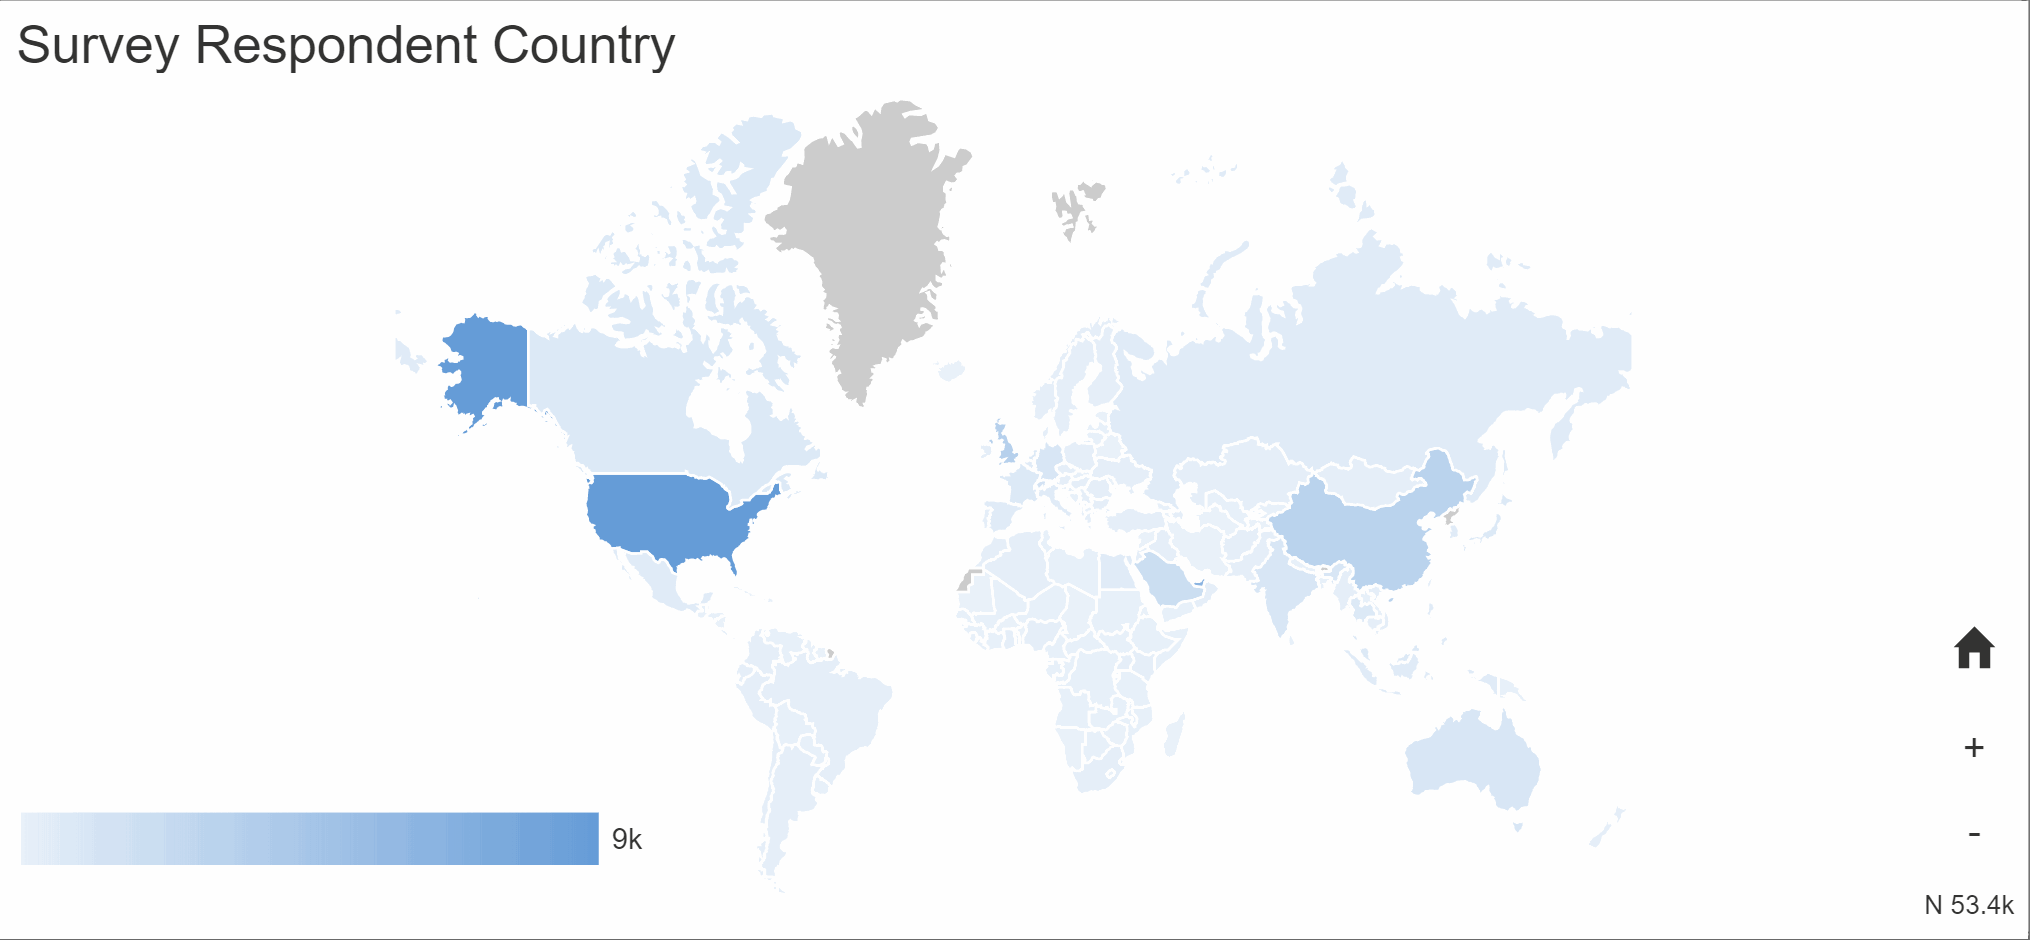
Our report element: Map, lets you explore and visualize the locations of your respondents.
- Edit an existing report or create a new report.
- Add an element or click on the Map element that you wish to edit.
The properties pane will open on the right-side of the screen.
Geolocation of survey respondents
You can pan around and zoom in. Hover over a country, state, province or city to see a count of respondents. The darker the color, the more respondents. Click on a country, state or province to zoom to a deeper level of detail.
Filter
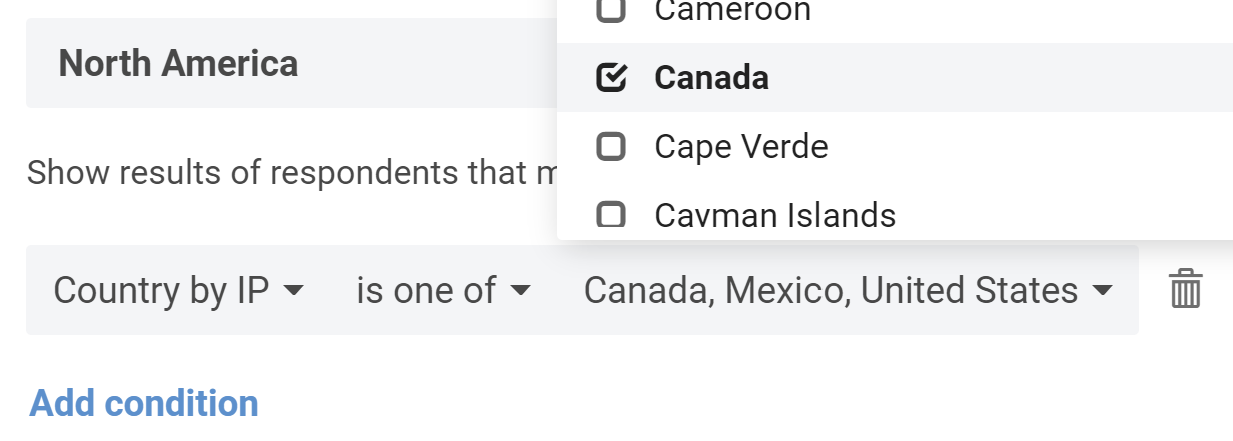
The map only shows respondents that match the current filters. The map always starts at the widest view that can show all the locations of your respondents. You can have a map start at the country level by filtering that element to that country only.
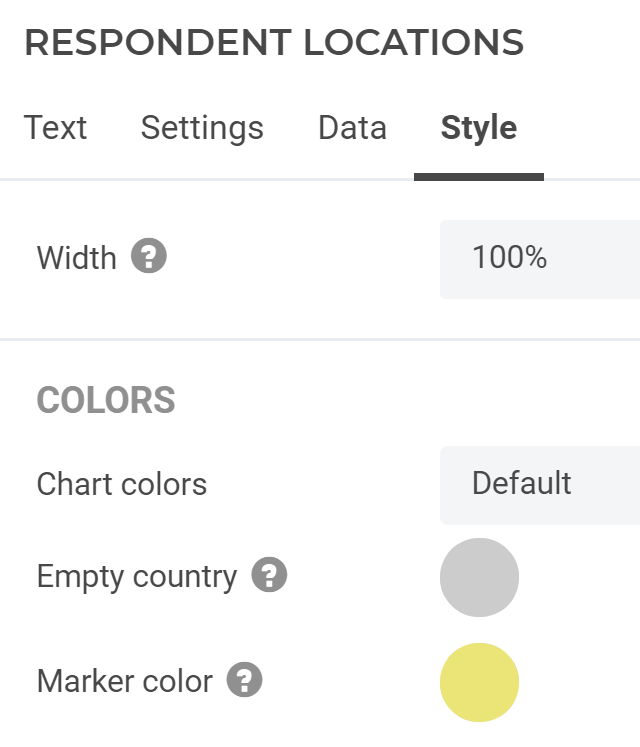
Style
- Width: Set the width of the element to the full report width (100%), only half of the report screen, one third, etc.
- Empty country: The color that countries, states and provinces should have if they have no respondents in them.
- Marker color: The color for the circles when zoomed in to the city level. The size of the circle gets larger, as the city has more respondents.
2 comments
Join the conversationJason Diceman - February, 2020
Is this only for guessing location based on IP, or can we include postal code / zip cone questions that can then be mapped?
Alexander Dobronte - February, 2020
You are correct, the location is based on IP address. We will be expanding this to include a new question type that requests the location from the browser which is more accurate. It will also later support the location fields of contacts.