The “QuickView” report was designed to offer a fast, but limited, view of your survey results. A few years ago, we’ve launched the ReportBuilder, a powerful tool that allows you to create more insightful and advanced reports.
The ReportBuilder can do everything the old QuickView can do, and much more.
Open basic report
Opening the ReportBuilder only takes one click more than opening the QuickView. You can create different types of reports, one of the being the basic report:
- Open your survey and go to the Analyze tab.
- Click Reports.
- Click on Create report.
![]()
- Select Basic report.
The basic report offers a simple view of the results, often using just one element per question. It will look the most like the old QuickView.
Open smart report
There’s another type of report that the ReportBuilder offers: the smart report. As the name indicates, this is a much smarter report that the basic report and aims to give you more insights into the data already by using a combination of elements, applying breakouts automatically, …
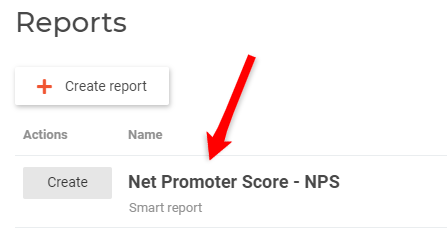
This report is much better when you really want to dive deep into the results and gain actionable insights. This is the report that is offered by default in the reports overview when you open Analyze > Reports for the first time:
- Open your survey and go to the Analyze tab.
- Click Reports.
- Click on the first report in the list:
All of the options that are further explained in this article are available for both the basic and smart reports. The only difference is the basis from which you start.
Filter results
In the old QuickView, you could click inside charts to filter the results. In the ReportBuilder, you can use the Filter bar, and it’s just as easy. Simply use the dropdowns to filter your report.
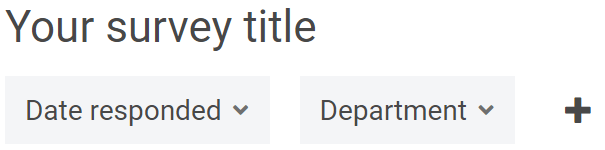
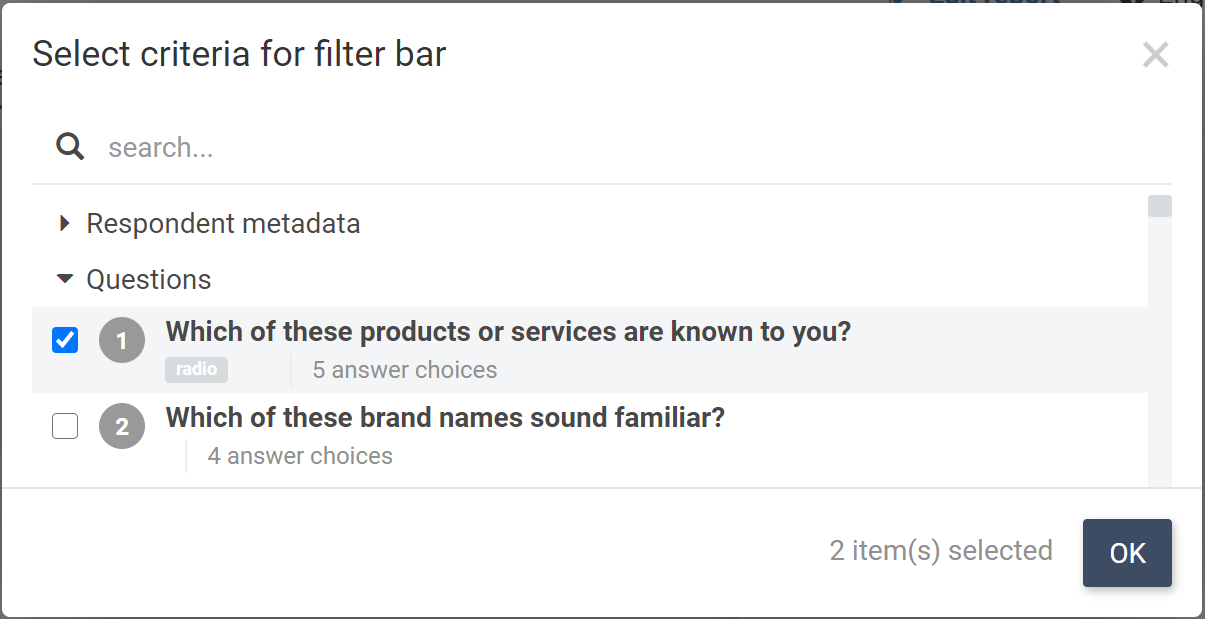
To add other questions or fields, click the plus button. In the pop-up that appears, select the questions and fields you want to filter on and click OK.
Note: the filter bar is not visible when you’re editing the report. If you’re in edit mode (Builder), click View & Analyze to open the Report Viewer.
You can read more about the use and possibilities of the filter bar in our Filter Bar article.
Edit report
By default, when you open a report, you’re in view mode (Report Viewer). To edit the report, use either of these methods:
- If you’re in the Report Viewer, simply click the Edit report button in the toolbar.

- On mobile, use the
 menu and select Edit.
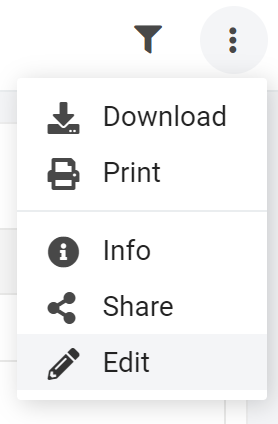
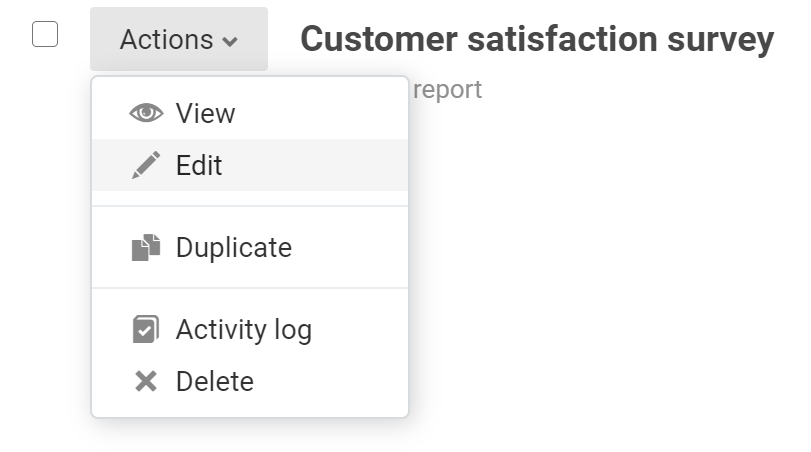
- From the list of reports, you choose Actions > Edit.
Download report or raw data
Downloading your report or raw data is really easy in the ReportBuilder. Just click the ![]() icon in the toolbar.
icon in the toolbar.
You can download the report as a PDF or PowerPoint file. Also, you can download all raw data matching your current filters.
Note: on mobile devices, use the ![]() menu and select Download. In edit mode (Builder), use the
menu and select Download. In edit mode (Builder), use the ![]() menu and select Download.
menu and select Download.
Share report
Sharing a report with someone else is just as easy in the ReportBuilder. There are even some powerful extra options, like creating multiple shared reports with different filters.
- To share a report, click the
 icon in the toolbar.
On mobile devices, use the menu and select Share. In edit mode (Builder), use the  menu and select Share.
 - Then click Add share. Optionally configure some share options and click Create share.
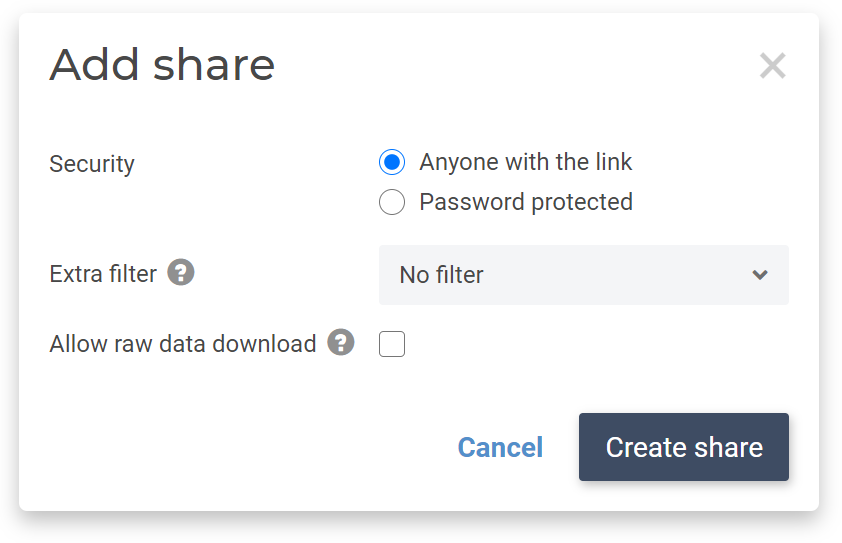
- You’ll get a share link. Copy the link and send it to the person you want to share the report with.
You can read more about shared reports in our Share a survey report article.
Change language
In the old QuickView, you could use a dropdown to change the active language. This works exactly the same in the ReportBuilder. Just use the language dropdown in the toolbar. On mobile devices, you can find this in the ![]() menu.
menu.
You can manage the available languages in the ReportBuilder:
- Edit the report.
- Open the menu and click Report.
- Go to the Languages tab.
Here you can add or remove languages, or change the default language.
Exclude questions from report
In the old QuickView, you could show or hide specific questions in the report. In the ReportBuilder you can also hide elements, or even permanently delete them from your report.
To start, edit the report. Now select the element you want to delete or hide. You can do this by clicking the element itself, or the item in the table of contents. On the right you’ll see a panel with all details of this element.
You can either delete an element or temporarily hide it.
Delete element
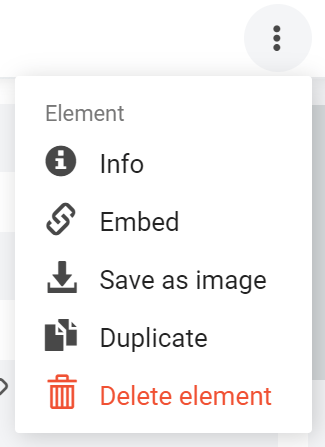
To delete an element, use the ![]() menu and select Delete element:
menu and select Delete element:
Temporarily hide element
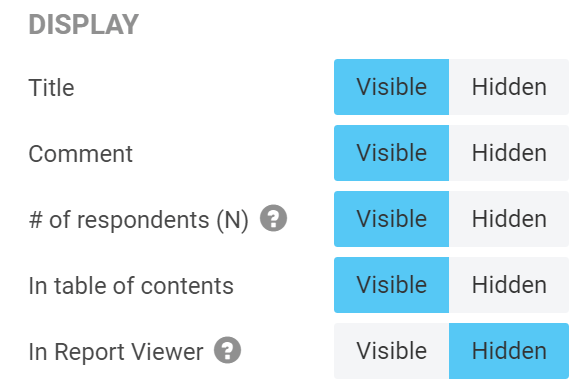
To prevent an element from being visible inside the Report Viewer, do the following:
- Navigate to the Style tab.
- Scroll down to the Display section.
- Find the In Report Viewer option and select Hidden.
Change chart type
In the old QuickView, you could change the chart type, for example from a pie chart to a column chart. This works differently in the ReportBuilder, since there are more possibilities. You can create multiple charts for the same question. For example, you could show a gauge for an NPS question, together with a timeline with the evolution of that NPS value.
These are the steps to add another element for the same question:
- Edit the report.
- Click Add element.

- Choose the question and element type. The element will now be created.
That’s all. If you want, you can also delete the existing element.
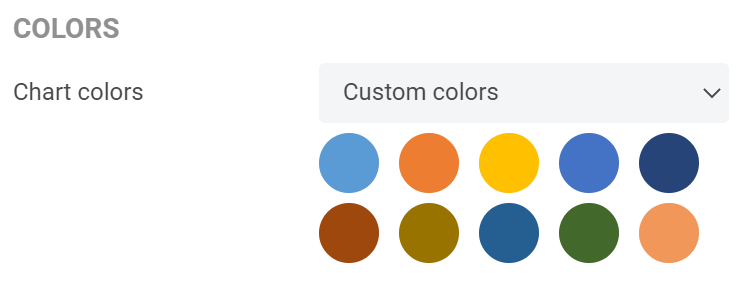
Change colors
In the old QuickView, you could change the chart colors. In the ReportBuilder you can do this too. You can even use some handy presets, like positive to negative colors, the default theme colors or custom colors. You can change the style of a single element, or even the whole report.
Start by editing the report.
To change the style of an element:
- Click the element to open the properties pane.
- Go to the Style tab.
- You can find the chart colors inside the Colors section.
To change the style of the whole report:
- Open the menu and click Style
- Most colors can be found on the Elements tab.
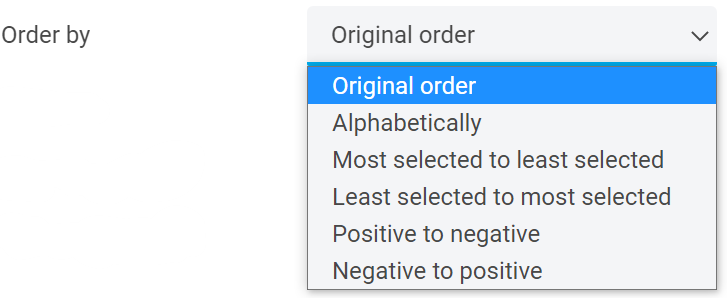
Change order of chart data
In the old QuickView, you could change the order of the chart data. The ReportBuilder allows this too, including more sorting options. Some of the most common options are alphabetically or most to least selected.
- Edit the report.
- Click the element to open the properties pane.
- Go to the Settings tab.
- In the Results section, use the Order by dropdown.
Change data labels
In the QuickView, it was possible to change data labels for questions. This is now possible inside the question editor, not the ReportBuilder.
You can find the question editor in the by opening a survey and going to Questions. Click on the arrow next to a question and select Edit. You can change the data label in the Settings.
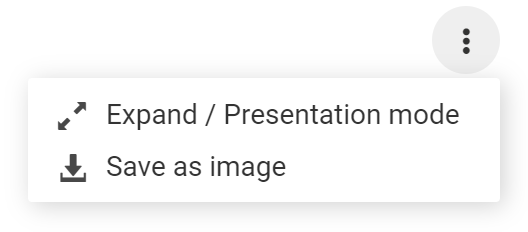
Save chart as image
In the old QuickView, you could save a chart as an image. This works exactly the same in the ReportBuilder.
From inside the Viewer, when you move your mouse over an element, the ![]() menu becomes visible. Click it and select Save as image.
menu becomes visible. Click it and select Save as image.
On mobile devices, click the element to display the ![]() menu. Click it and select Save as image.
menu. Click it and select Save as image.
If you’re inside the Builder, first click an element to select it. On the right side of the properties pane, open the ![]() menu and click Save as image.
menu and click Save as image.
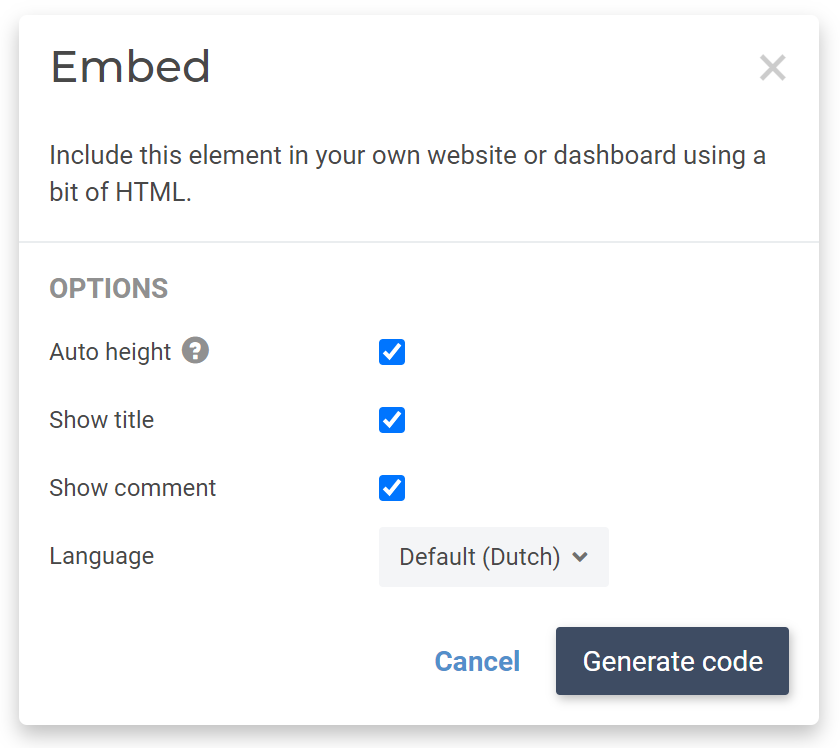
Share or embed chart
Sharing a chart is also possible in the ReportBuilder. Just follow these steps:
- Edit the report.
- Click the element to select it.
- On the right side of the properties pane, click the menu and choose Embed.
- Optionally change the embed configuration and click Generate code.
- A snippet of HTML is generated. This can be used to embed the element on any website.
There, I hope this overview helps you in transitioning from our old QuickView reports to the ReportBuilder. As you may have understood, the ReportBuilder is so much more versatile. If you require more in-depth information please have a look at all of the available articles in the ReportBuilder section.
Leave a Reply