The Distribution report gives a quick and visual overview of the global response rates for your survey as well as the response rates broken out by the operational data that is available in the survey. The report updates in real-time just like all of our other reports.
Open the distribution report
- Go to the survey.
- Click on Analyze and then on Reports.
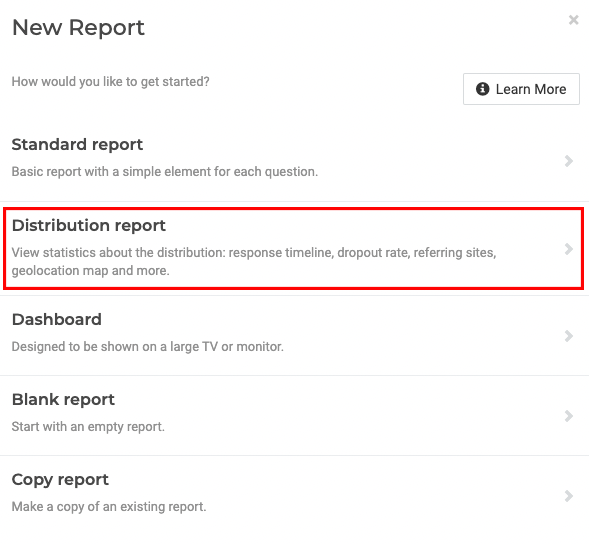
- Add a new report. Select Distribution report.
A new report will be created already containing different elements with all kinds of interesting data concerning your survey’s response rate, such as the number of completes broken down by day/week/month/… , the percentage of contacts that clicked through to the survey, a response timeline, etc.
Apply filters or breakouts to tweak these elements to your needs.
Dig in deeper
When you scroll all the way down this report you will come across an element called Number of respondents per. Add a breakout to this element to view the number of respondents per selected data source.
- Select this element.
- Go to the Data tab.
- Click on Add and select Breakout.
- Select the question or operational data for which you wish to see the response rate broken out. You will notice that the element title adds the selected data source to the title.
- Duplicate the element and repeat the above steps to add more response rate breakouts.
Share the distribution report
Just like for any other ReportBuilder report you can share the distribution report with others by creating shares. Add additional filters to the shares so that people with access to a particular share only see the response rates that they need to see.
Password-protect a share if the results may not be publicly available.
Leave a Reply